
Figure 7.
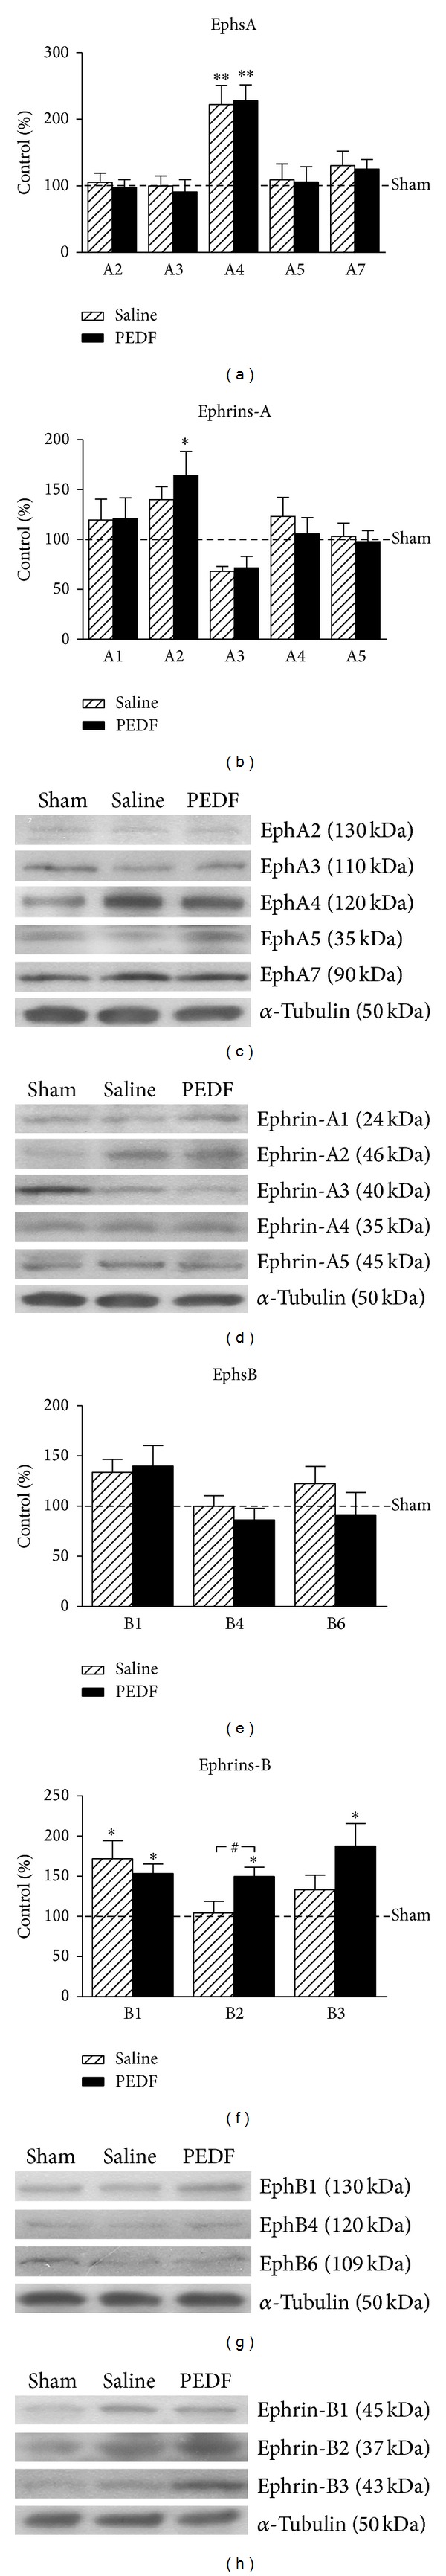
Levels of type A Eph receptors (A2–5 and A7, (a)), type A ephrins (A1–5, (b)), type B Eph receptors (B1, B4, and B6, (e)), and type B ephrins (B1–3, (f)), detected by western blot, in the ventral region of the lumbar spinal cord of Sham, Saline, and PEDF groups 6 weeks after surgery. Values of the relative optical density of the signal in the bands were expressed as a percentage of respective Sham groups. The representative bands of type A Eph receptors and ephrins are illustrated in (c) and (d), respectively, and the representative bands of type B Eph receptors and ephrins are illustrated in (g) and (h), respectively. α-tubulin (50 kDa) was used as sample loading control. *(P < 0.05) and **(P < 0.01) when the Saline/PEDF group differs from Sham and #(P < 0.05) when the PEDF group differs from Saline, according the one-way ANOVA followed by Tukey posttest. Means ± s.e.m., n = 6–8.