
Figure 3.
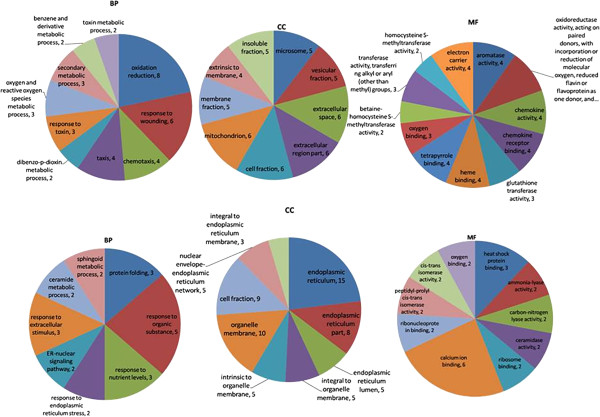
DEG GO analysis in liver tissue. Top three charts show gene ontology annotation processes (biological process (BP), cellular component (CC), and molecular functions (MF)) of up-regulated genes. Lower three charts show processes (BP, CC, and MF) of down-regulated genes.