
Fig. 6.
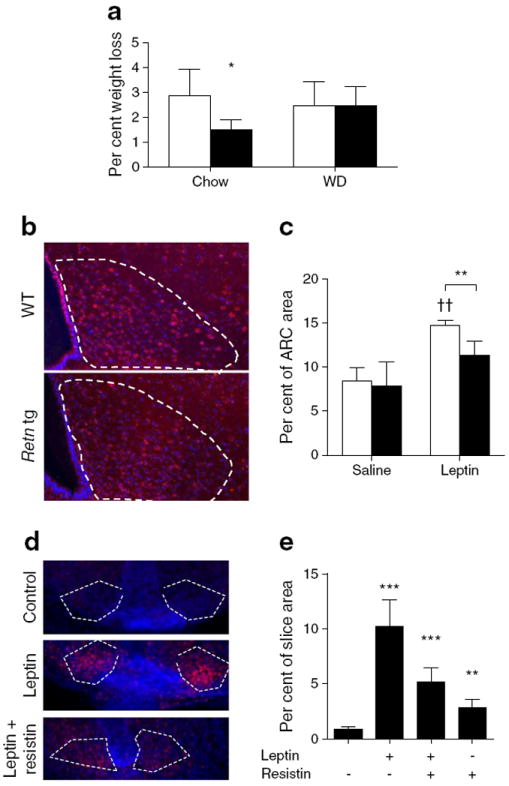
Retn tg mice exhibit reduced hypothalamic leptin responsiveness. (a) Leptin-induced weight loss in chow- and western diet-fed male wild-type (white bars) and Retn tg (black bars) male mice. (b) Phosphorylated STAT3 (pSTAT3, red; DAPI, blue) in response to administration of leptin into the third cerebral ventricle and (c) quantified pSTAT3-positive hypothalamic arcuate nucleus (ARC) area. (d) pSTAT3 labelling upon acute resistin exposure before leptin treatment. (e) Quantified pSTAT3-positive area in the ARC of hypothalamic slices. Resistin mutes leptin signalling (p=0.068). White dashed lines indicate the ARC. *p<0.05, **p<0.01 and ***p<0.001 vs wild type or no treatment. ††p<0.01 vs saline