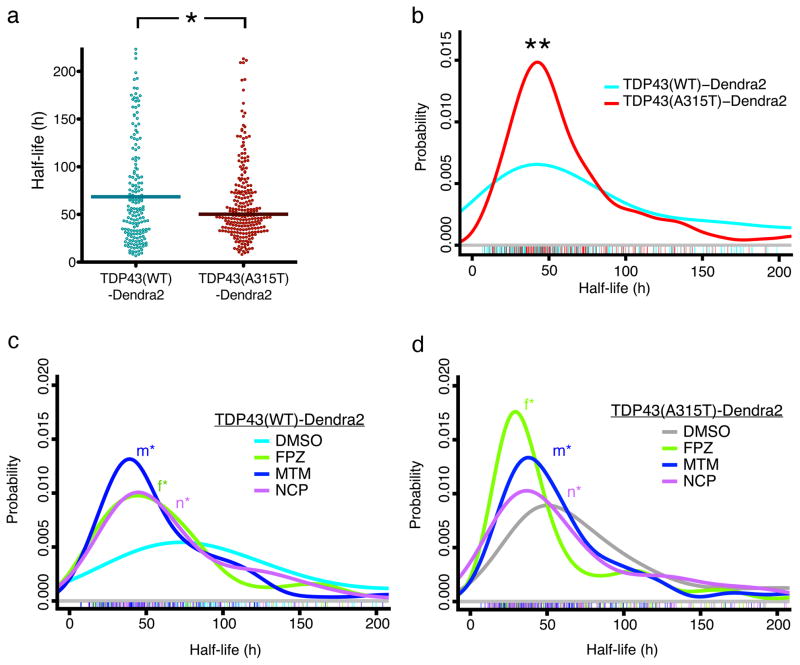
Figure 3. Optical pulse labeling of TDP43.
(a) Scatter plot depicting half-life measurements for individual cells expressing TDP43(WT)-Dendra2 (cyan, n=206) and TDP43(A315T)-Dendra2 (red, n=251). * p=0.0029, U = 11797, Mann-Whitney test. (b) Probability density plot for single-cell half-life measurements, demonstrating a reduced half-life of TDP43(A315T)-Dendra2 (red, n=251), compared to TDP43(WT)-Dendra2 (cyan, n=206; ** p=0.0007, two-sided Kolmogorov-Smirnov test). Values were pooled from eight wells per condition, performed in quadruplicate. Probability density plots of single-cell half-life measurements for TDP43(WT)-Dendra2 (c) and TDP43(A315T)-Dendra2 (d). At 0.5 μM, all three compounds significantly reduced TDP43(WT)-Dendra2 half-life, compared to vehicle control (DMSO, n=110; FPZ, n=96, *f p=1×10⁻⁴; MTM, n=129, *m p=2×10⁻⁷; NCP, n=111, *n p=2×10⁻⁵, two-sided Kolmogorov-Smirnov test). The compounds also reduced TDP43(A315T)-Dendra2 half-life, in comparison to vehicle control (DMSO, n=120; FPZ, n=155, *f p=2×10⁻⁹; MTM, n=152, *m p=0.004; NCP, n=111, *n p=0.005, two-sided Kolmogorov-Smirnov test). Colored hash marks represent values from individual neurons in (b), (c) and (d). Values were obtained from eight wells per condition, performed in triplicate.

