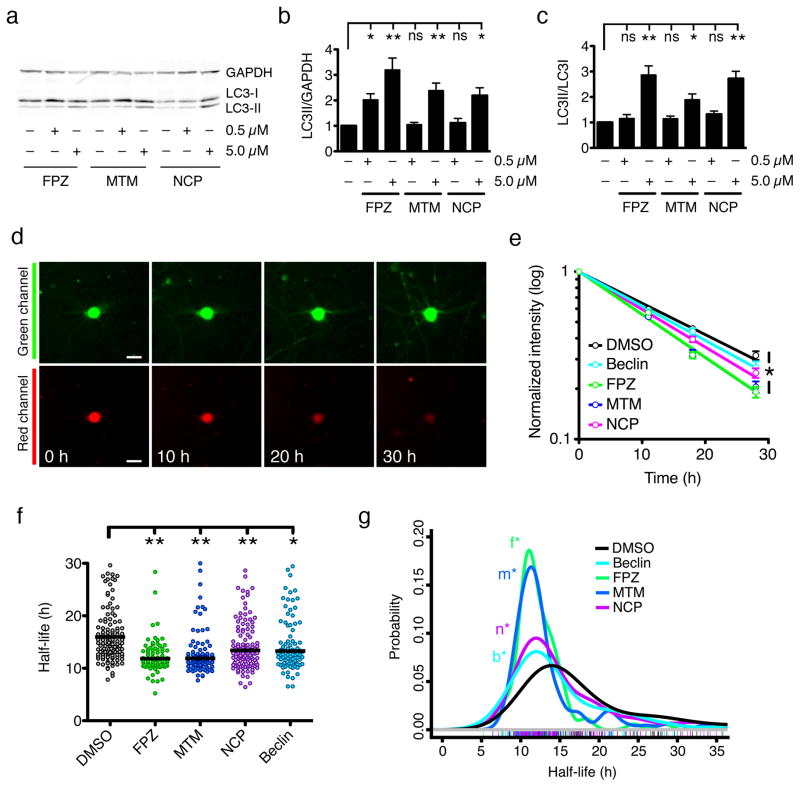
Figure 4. Induction of autophagy by a family of small molecules.
(a). Each compound significantly increased the LC3-II/GAPDH (b) and LC3-II/LC3-I (c) ratios at 5 μM, but not 0.5 μM [ns, p > 0.05; * 0.05 < p < 0.01, ** p < 0.01; F = 13.74 (b) and 9.74 (c), one-way ANOVA with Dunnett’s post-test]. Error bars represent ± SEM. Values pooled from five independent experiments. (d) Optical pulse-labeling of LC3-Dendra2 in rodent primary cortical neurons. Scale bar = 25 μm. (e) The change in red fluorescence intensity over time was used to calculate LC3-Dendra2 half-life, as in Fig. 2 (DMSO, R2 = 0.7333; Beclin, R2 = 0.6968, FPZ, R2 = 0.8752; MTM, R2 = 0.8447; NCP, R2 = 0.8357; * p < 0.0001 for global trend, F = 12.6, extra sum-of-squares F-test). Error bars represent ± SEM. (f) The median single-cell half-life of LC3-Dendra2 was significantly reduced by beclin expression or treatment with 0.5 μM NCP, MTM, and FPZ (* p < 0.01, ** p < 0.001, Kruskal Wallis statistic = 52.56, Kruskal-Wallis with Dunn’s test). (g) Probability density plot of LC3-Dendra2 half-life measurements from individual neurons treated with vehicle control (DMSO, n=140), NCP (n=128), MTM (n=91), or FPZ (n=77), or those expressing beclin (n=101). *n, p=6×10⁻⁴; *m, p=1×10⁻¹⁰; *f, p=5×10⁻⁹; *b, p=2×10⁻³; two-sided Kolmogorov-Smirnov test). Colored hash marks represent values from individual neurons. Values pooled from eight wells per condition, performed in triplicate.

