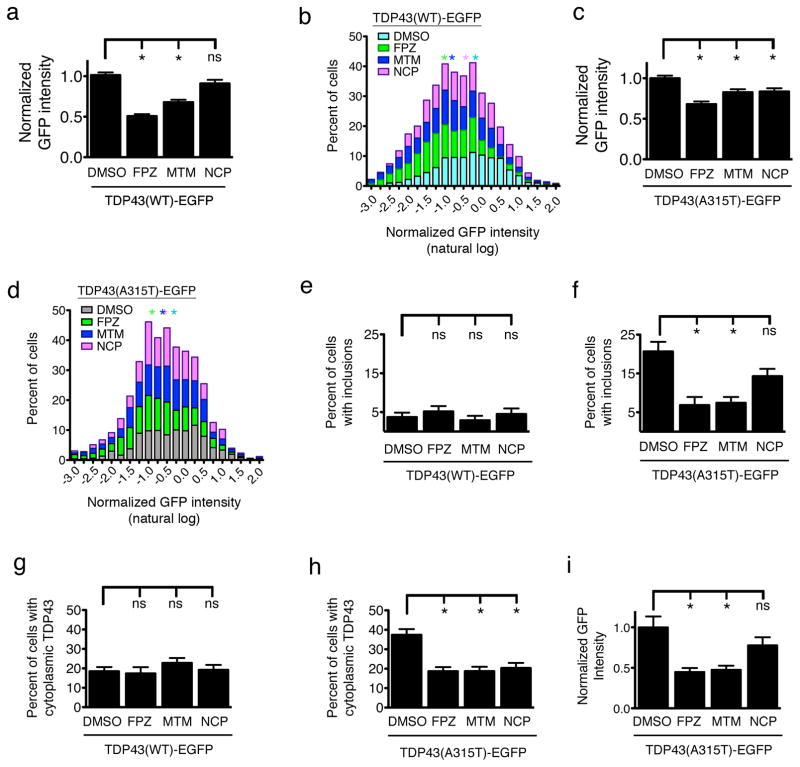
Figure 5. Autophagy induction reduces TDP43 levels, aggregation, and cytoplasmic mislocalization.
(a) FPZ (n=490) and MTM (n=580), but not NCP (n=523), lowered total TDP43(WT)-EGFP levels in comparison to vehicle (DMSO, n=1007). (b) Histogram of normalized, log-transformed TDP43(WT)-EGFP levels. (c) Each compound also reduced TDP43(A315T)-EGFP levels (DMSO, n=983; FPZ, n=550; MTM, n=542; NCP, n=493). (d) Histogram of single-cell TDP43(A315T)-EGFP levels. Asterisks in (b) and (d) denote median values for cells exposed to vehicle (cyan), FPZ (green), MTM (blue) or NPZ (purple). For FPZ, MTM, NCP vs. DMSO in (a) and (d), p < 1×10⁻³ by two-sided Kolmogorov-Smirnov test. (e) No compound reduced TDP43(WT)-EGFP inclusions 48 h after transfection (DMSO, n=360; FPZ, n=194; MTM, n=234; NCP, n=203). (f) FPZ and MTM, but not NCP, reduced TDP43(A315T)-EGFP inclusions at 48 h (DMSO, n=327; FPZ, n=226; MTM, n=262; NCP, n=253). (g) No compound affected TDP43(WT)-EGFP localization 24 h after transfection (DMSO, n=256; FPZ, n=212; MTM, n=250; NCP, n=241). Each compound (h) prevented TDP43(A315T)-EGFP cytoplasmic mislocalization (DMSO, n=233; FPZ, n=268; MTM, n=263; NCP, n=270) and (i) reduced cytoplasmic TDP43(A315T)-EGFP levels (DMSO, n=125; FPZ, n=102; MTM, n=121; NCP, n=144. * p < 0.05; ns, p > 0.05). For (a), (c), and (e–i), * p < 0.05; ns, p > 0.05, one-way ANOVA with Dunnett’s test. Error bars represent ± SEM. Values in (a–d) pooled from 8–12 wells per condition, from six experiments; values in (e–h) pooled from eight wells per condition, in triplicate; values in (i) pooled from five wells per condition, in duplicate.

