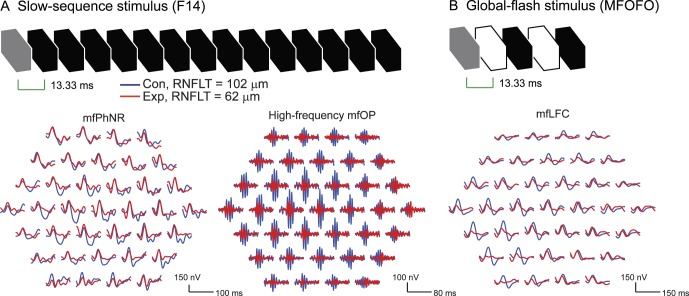
Figure 1.
Multifocal ERG stimuli and signal processing. (A) F14 stimulus and F14 trace arrays after the original responses were filtered by low-pass (50 Hz) and band-pass (110–224 Hz) filters. The low-pass filtered traces were used to quantify mfPhNR, whereas the band-passed traces were used to quantify mfOP. (B) The global-flash stimulus and the low-pass–filtered (25 Hz) trace array for LFC analysis. The gray frames were the m-frames. For the global-flash stimulus, the second and fourth frames contained the global flashes. All the other frames in both stimuli were dark frames. In this and subsequent figures, hexagon arrays are shown in retina view for the right eye. The arrays include approximately 11.5° of the central visual field with the fovea aligned with the central hexagon.

