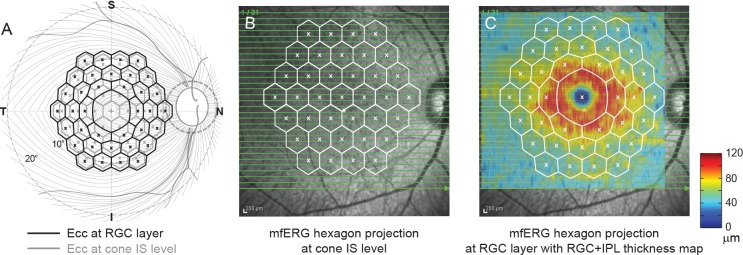
Figure 3.

Correction of RGC displacement. (A) A schematic diagram of the relation between the projections of the mfERG hexagon array at cone IS and RGC layer levels. (B) Registration of the mfERG hexagon array projection at cone IS level on the 30° × 30° fundus image. (C) Registration of the mfERG hexagon array projection at RGC level on the fundus image and RGC+IPL thickness map.
