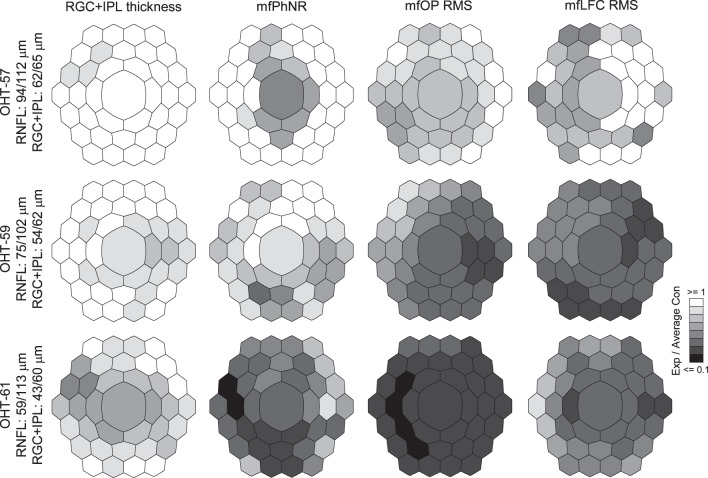
Figure 5.
Ratio maps of RGC+IPL thickness and mfERG measures for three animals at different stages of structural loss. Top row: OHT-57 with mild structural loss. Middle row: OHT-59 with moderate structural loss. Bottom row: OHT-61 with the most severe structural loss. For OHT-57 and OHT-59, averages of all 4 recording and imaging sessions from the Con eyes were used to calculate the ratios of remaining structure and function in the Exp eyes. For OHT-61, only one recording and imaging session was available to calculate the ratios of remaining measures in the Exp eye.

