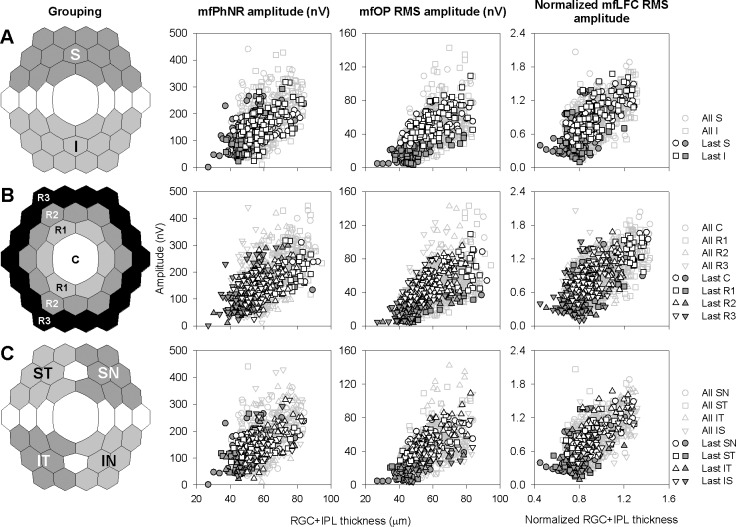
Figure 7.
Grouping of central 37 hexagons and scatter plots showing relations between mfERG measures and RGC+IPL thickness with different grouping strategies. Black open and filled dark symbols: Con and Exp data, respectively, from last imaging/ERG session of all animals. Gray symbols: Con and Exp data from all sessions. (A) Grouping by hemifields and corresponding structure–function relations. S, superior retina; I, inferior retina. (B) Grouping by rings and corresponding structure–function relations. C, central hexagon; R1, Ring 1; R2, Ring 2; R3, Ring 3. (C) Grouping by quadrants and corresponding structure–function relations. SN,superonasal retina; ST, superotemporal retina; IT, inferotemporal retina; IN, inferonasal retina.

