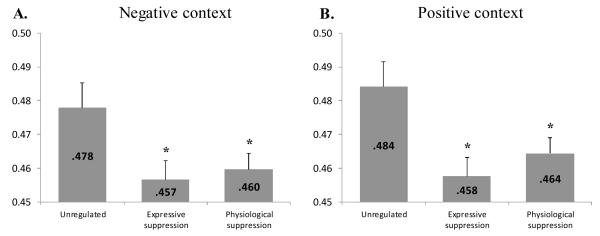
Figure 1.
Study 1 cross-correlations during negative emotion induction (Panel A) and positive emotion induction (Panel B) for unregulated trials and different suppression strategies. Results are the means of the maximum correlations observed for each trial in a given condition. Error bars are SEM. A-priori contrasts with the unregulated condition are reported above the suppression columns: * p<.05.

