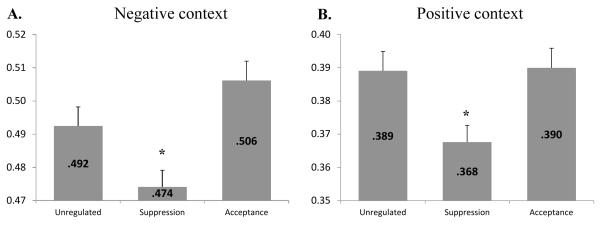
Figure 2.

Study 2 cross-correlations during negative emotion induction (Panel A) and positive emotion induction (Panel B) for unregulated trials, a suppression strategy, and an acceptance strategy. Results are the means of the maximum correlations observed for each trial in a given condition. Error bars are SEM. Significant contrasts are reported above the suppression columns: * p<.05 both with the unregulated and with the acceptance condition.
