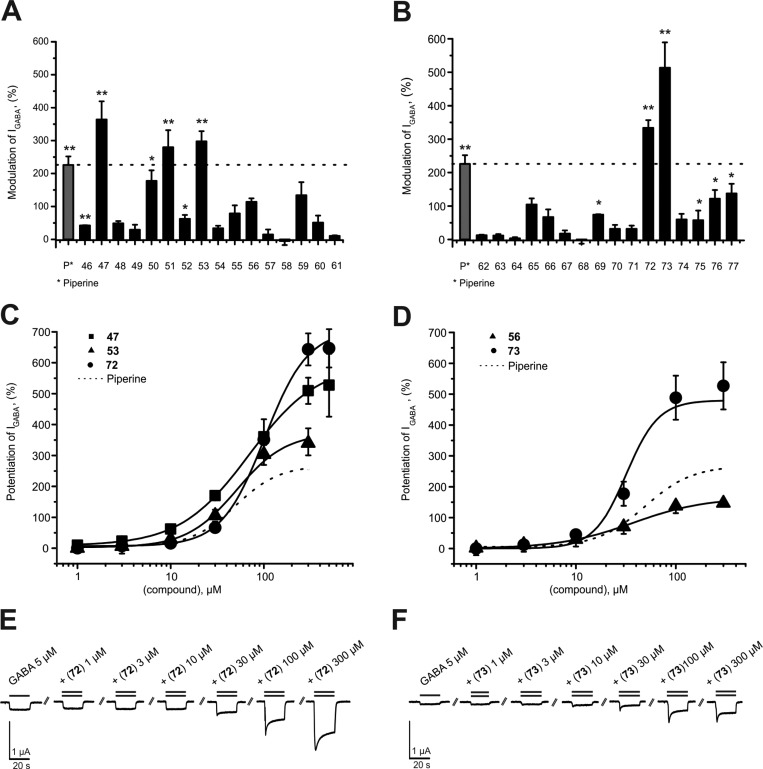
Figure 3.
(A, B) Modulation of chloride currents through GABAA receptors composed of α1, β2, and γ2S subunits by 100 μM piperine and the indicated derivatives (dotted line indicates cutoff for highly active compounds). (C, D) Concentration-dependent IGABA (EC3–7) enhancement through α1β2γ2S GABAA receptors: (C) by 47 (■), 53 (▲), and 72 (●), ranked by efficiency, and (D) by 56 (▲) and 73 (●), ranked by potency, compared to piperine (dotted line). (E, F) Representative IGABA modulated by (E) 72 and (F) 73. Data represent mean ± SEM from at least three oocytes and two oocyte batches. Asterisks indicate statistically significant differences from zero: *p < 0.05, **p < 0.01. Data for piperine were taken from ref (31).

