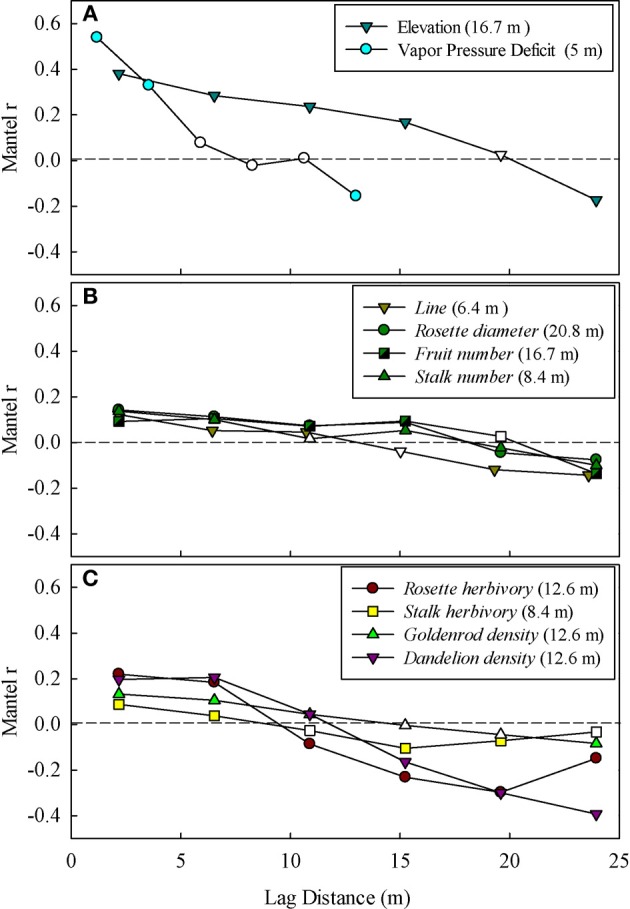
Figure 2.

Mantel correlograms showing significant spatial autocorrelation for (A) abiotic environmental factors (Elevation, and Vapor pressure deficit), (B) intra-specific performance and fitness measures (rosette diameter, stalk number, stalk diameter, fruit number, and line), and (C) inter-specific neighbors and herbivory (goldenrod density, dandelion density, rosette herbivory, and stalk herbivory). Filled (significant) and open (non-significant) circles represent statistical significance (P ≤ 0.05) of Mantel correlation coefficients and each point marks the middle point of the respective lag distance bin. The range of autocorrelation for each variable is given next to the legend. Only significant (P ≤ 0.05) correlograms are shown.
