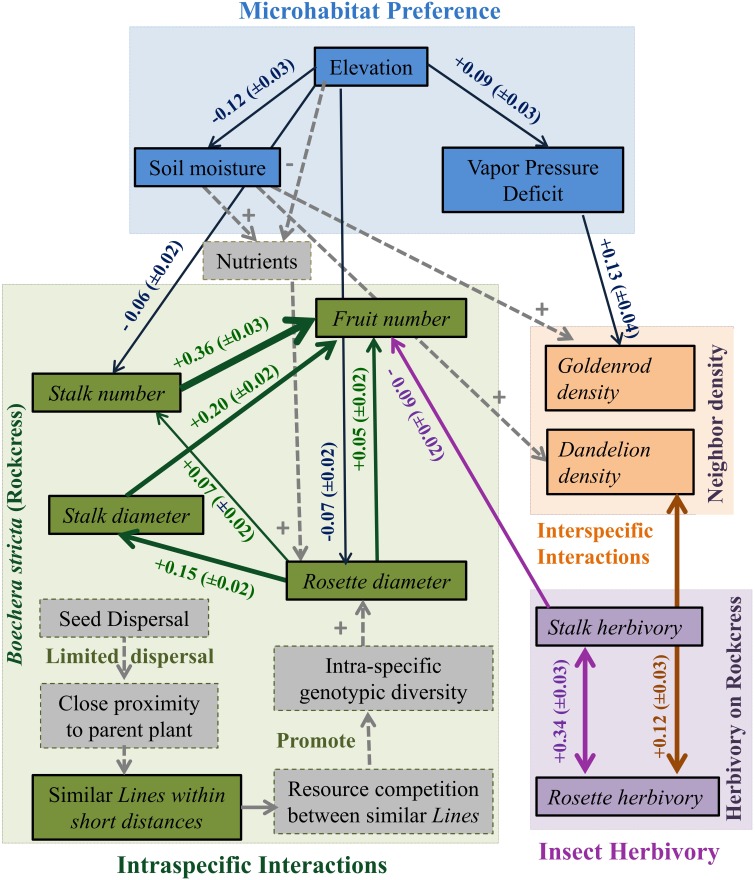
Figure 4.
An ecological network of interactions between abiotic environmental factors (Elevation, Vapor pressure deficit, Soil moisture, and Nutrients), intra-specific performance and fitness measures (rosette diameter, stalk diameter, fruit number, stalk number, and line), and inter-specific neighbors and herbivory (goldenrod density, dandelion density, rosette herbivory, and stalk herbivory) in a rockcress population. Boxes represent observed variables and arrows represent significant partial correlations. Sign associated with each arrow describes the positive or negative influence. Thickness of arrows is related to the Partial Mantel correlation coefficient associated with each arrow and 90% confidence interval is given in the parentheses. Unidirectional arrows represent positive or negative influence and bidirectional arrows represent simple correlations. The dotted gray boxes display the variables not measured in this study and dotted gray arrows describe the proposed mechanisms to explain the relationships.

