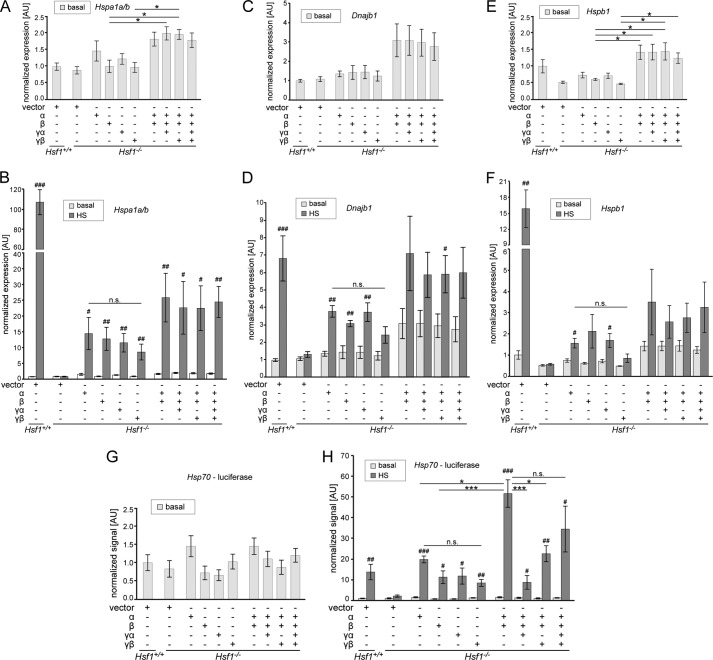
FIGURE 6.
The transcriptional activities of HSF1 isoforms. A–F, quantitative PCR analysis of HSP transcript levels in wild type (Hsf1+/+) and Hsf1 knock-out (Hsf1−/−) fibroblast lines. Cell lines were transfected with plasmids as indicated below the graphs. Quantitative PCR signals for Hspa1a/b (A and B), Dnajb1 (C and D), and Hspb1 (E and F) were normalized to the geometric mean of GAPDH and β-actin. Graphs show either the HSP transcript levels of cells that were kept constantly at 37 °C (basal) (A, C, and E) or the basal conditions as before together with the transcript levels 2 h after heat shock (HS) (45 min of heat shock, 2 h of recovery at 37 °C) (B, D, and F). The mean expression values are shown normalized to wild type levels (set to 1). Data are mean (n > 4) ± S.E. Statistics for basal versus heat shock conditions: #, p < 0.05, ##, p < 0.01, ###, p < 0.001. Statistics for comparison of isoforms for each condition: *, p < 0.05. AU = arbitrary units. G–H, Hsp70 promoter firefly luciferase assay. Cell lines were transfected with plasmids as indicated below the graphs. In addition, thymidine kinase promoter-driven Renilla luciferase was added in all conditions to normalize the obtained Hsp70 promoter firefly luciferase signals. Graphs show either the signals for cells that were kept constantly at 37 °C (G, basal) or the basal conditions as before together with the transcript levels 2 h after heat shock (45 min of heat shock, 2 h of recovery at 37 °C) (H). The mean signal values are shown normalized to the wild type signal (set to 1). Data are mean (n > 3) ± S.E. Statistics for basal versus heat shock conditions: #, p < 0.05, ##, p < 0.01, ###, p < 0.001. Statistics for comparison of isoforms for each condition: *, p < 0.05, ***, p < 0.001. n.s. = not significant.

