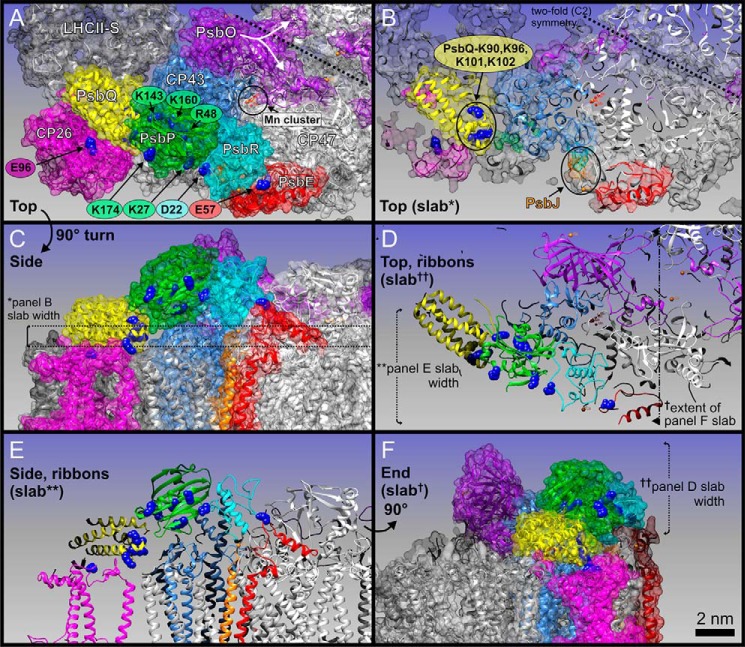
FIGURE 5.
Localization of PsbP, PsbQ, and PsbR within a pseudo-atomic C2S2M2 LHCII-PSII supercomplex three-dimensional model for higher plants. Protein coordinates (see text for PDB IDs) are shown either as schematic ribbons or transparent space-filling spheres as follows: PsbP (green), PsbQ (yellow), CP43 (light blue), PsbO (purple), PsbR (cyan), PsbE (red), CP26 (magenta), LHCII-S (light gray), and CP47 (white). A, top view, looking down onto the membrane plane from the lumen. Subunit labels are in white. Key amino acid residues of cross-linked sites are shown as blue spheres, and labels are color-coded as per associated proteins. Position of the Mn4CaO5 cluster (Mn cluster) is circled in black; manganese atoms are small red spheres and calcium atoms are orange. The PsbO protein of each PSII core monomer has a distinct feature that extends over to the adjacent PSII monomer, here noted by a white star and emphasized with a split arrow. B, slab (cut-away) view of A. PsbJ is highlighted in orange, due to it being mostly hidden in A. The 2-fold symmetry of the overall PSII dimeric core is emphasized by dashed line. C, side view of A. The thickness of the slab in B (∼1.2 nm) is marked with * and shown with dashed lines. D, slab of the entire lumenally protruding protein domain shown in schematic ribbon form, emphasizing the cross-links between key residues of PsbP, PsbQ, PsbR, and PsbE; note this is also in the same orientation as A and B. The extent of E and F slabs is also shown. E, slabbed side view of C, emphasizing all cross-link site key residues. The depth of this slab is shown in D. F, end view of E and C, slabbed from the tip of LHCII-S to PsbE. The depth (∼5 nm) of D slab is also shown. Scale bar, 2 nm (for all panels).

