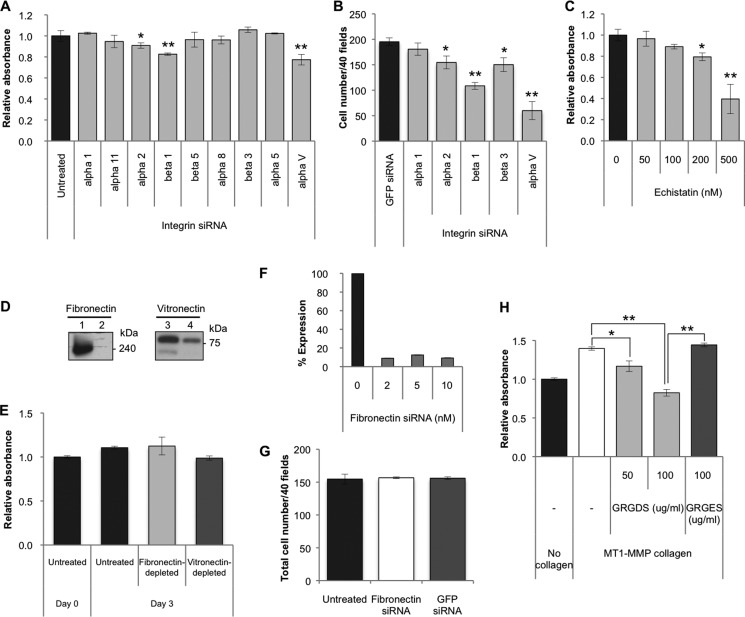
FIGURE 10.
Effects of silencing of integrins on proliferation of aHSCs. A, a WST-1 assay was carried out for cells treated with siRNA against integrin α1, α11, α2, β1, β5, α8, β3, α5, and αV at a concentration of 5 nm in DMEM containing 2% FBS at day 3 of transfection. Data are expressed in percentages of untreated aHSCs as mean ± S.D. of six independent samples. *, p < 0.05; **, p < 0.01 compared with untreated aHSCs. B, the number of cells treated with integrin α1, α2, β1, β3, and αV siRNAs at 5 nm in DMEM containing 2% FBS was counted at day 3 of transfection after they were stained with antibody against αSMA-Cy3 in 40 random fields per slide. Data are expressed as mean ± S.D. of three independent experiments. *, p < 0.05; **, p < 0.01 compared with siRNAGFP. C, the proliferation of aHSCs treated with echistatin at 50, 100, 200, and 500 nm in serum-free DMEM for 24 h was measured by the WST-1 assay system. Data are expressed in percentages as mean ± S.D. of six independent samples. *, p < 0.05; **, p < 0.01 compared with untreated aHSCs. D, fibronectin and vitronectin in FBS were removed by gelatin-Sepharose- or heparin-packed columns, respectively. Depletion of fibronectin (lane 2) and vitronectin (lane 4) from FBS was examined by Western blotting using antibody against fibronectin and vitronectin, respectively, with control FBS (lanes 1 and 3). E, aHSC were cultured in medium containing 10% FBS from which fibronectin and vitronectin were removed. The proliferation of aHSCs was quantified using the Premix WST-1 assay system at day 3 of treatment. No significant differences were observed. Data are expressed in percentages compared with untreated samples as mean ± S.D. of triplicate samples. F, knockdown of Fibronectin was examined by quantitative RT-PCR at day 2 of transfection. G, cell numbers of aHSCs transduced with siRNAFibronectin at 10 nm in DMEM with 2% FBS at day 3 of transfection were counted after they were stained with antibody against αSMA-Cy3 in 40 random fields/slide. Data are representated as mean ± S.D. of three independent experiments. H, aHSCs in an MT1-MMP collagen-coated plate were incubated with GRGDS (50 and 100 μg/ml) or GRGES (100 μg/ml) peptides for 72 h in serum-free DMEM. A WST-1 assay was carried out, and data are expressed in percentages of cell growth of control aHSCs as mean ± S.D. of triplicate samples. *, p < 0.05; **p < 0.01.

