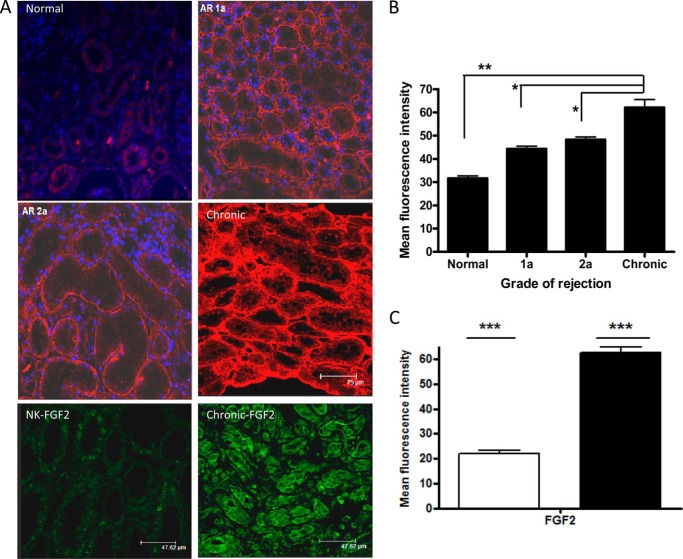
FIGURE 1.
Changes in HS3A8 epitope and FGF expression during renal rejection. A, immunohistochemistry of HS in kidney sections. Heavily sulfated HS was visualized with HS3A8 antibody and a Cy3-labeled secondary antibody. DAPI was used for nuclear counterstain. Kidney sections are representative for the indicated stages of rejection (acute rejection 1a, acute rejection 2a, chronic rejection) with normal tissue as control. The bottom two panels show representative stainings with FGF2 antibody and visualized with FITC-conjugated secondary antibody. B, quantification of the mean fluorescence intensity associated with the expression of HS3A8 epitope during various stages of renal rejection. C, quantification of the mean fluorescence intensity associated with the expression of FGF of normal (clear bar) and chronically rejected kidneys (filled). Five random fields per biopsy were analyzed using Image-J software. Results represent data from 15 patients in total (5 healthy, 3 acute rejection 1a, 2 acute rejection 2a, and 5 chronic rejection).

