
Figure 6.
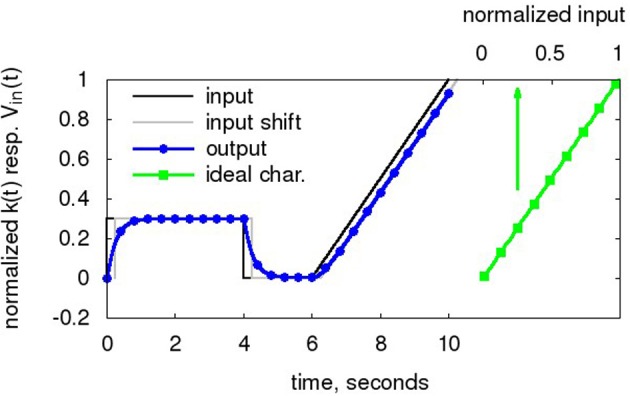
Input waveform Vin(t) (black). The Nengo simulator takes this normalized waveform as input. The digitized output k(t) (blue, circles), i.e., the state of the low-pass filter, is also normalized to 0..1. For comparison to the output, Vin(t) shifted by τPSC is also displayed (black, dashed). Also shown is the ideal transfer characteristic (green, dashed, squares) as computed from the decoder weights and tuning curves in Equation 3. Baseline taken from Table 1, with τPSC of 256 ms for enhanced delay visibility.