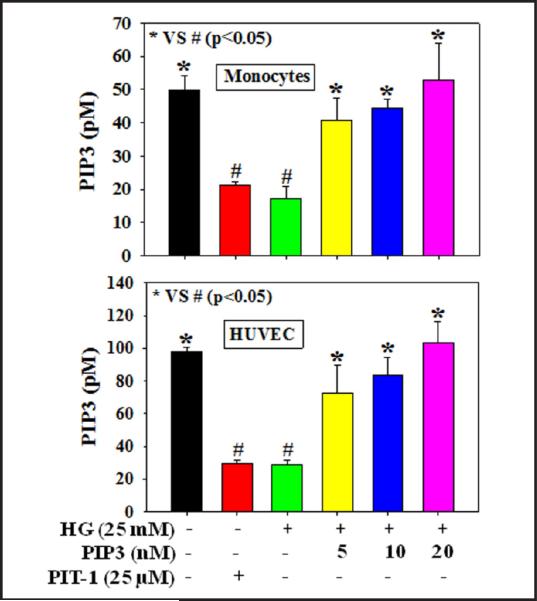
Fig. 1.
Intracellular PIP3 levels in THP-1 monocytes and HUVEC. A: PIP3 levels in THP-1 monocytes and B: PIP3 levels in HUVEC. Cells were pretreated with PIP3 (5, 10, or 20 nM) for 4 h followed by HG (25 mM) exposure for the next 20 h. Cells were also treated with the PIP3 inhibitor PIT-1 (25 μM) for 20 h. Values are expressed as mean ± SE (n=3). The difference between * vs # is considered significant at the p < 0.05 level

