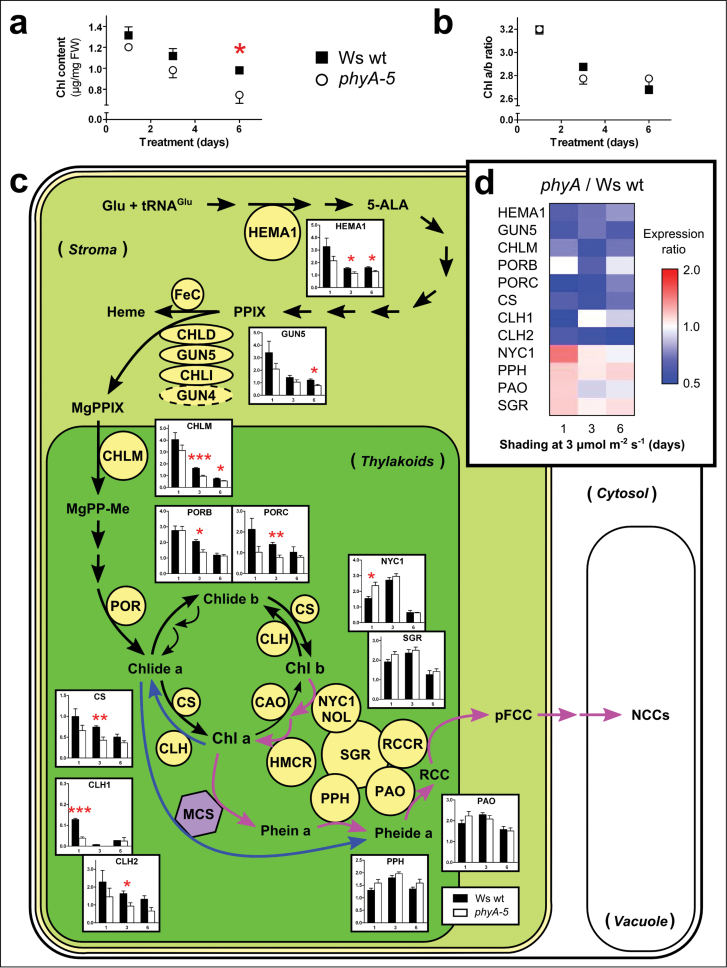
Fig. 4.
Regulation of the chlorophyll biosynthetic and catabolic pathways in shaded leaves of partially shaded Ws wt and Ws phyA-5 plants. Changes in (a) chlorophyll content, (b) chlorophyll a/b ratio, and (c) normalized fold expression of genes involved in the biosynthesis and degradation of chlorophyll in individually shaded leaves (3 μmol m–2 s–1) for 1, 3 or 6 d. The results in (c) were obtained using qPCR analyses and illustrate the differences in expression between Ws wt (black) and Ws phyA-5 plants (white). Enlarged figures are available in Supplementary Fig. S6 available at JXB online. (d) Heat map representing the transcript abundance expressed as a ratio between phyA-5 and Ws wt. Values are means ±SEM, n=4. Statistically significant t tests are notated: *, P <0.05; **, P <0.01; ***, P <0.001.

