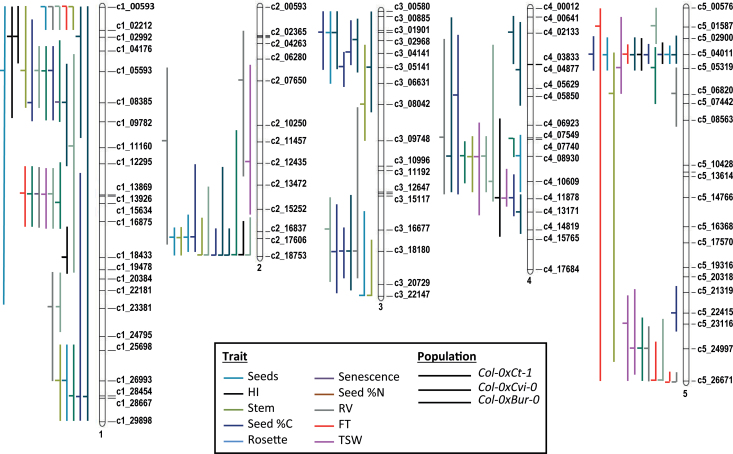
Fig. 2.
Mapping of 101 QTL detected for leaf senescence and for traits related to resource allocation, onto a single consensus map. Each QTL is shown by a horizontal line, indicating the most likely position, with a vertical line indicating the confidence interval around this position. Line style indicates the population where the QTL was detected. Line colour shows the trait affected. Numbers on the right correspond to the genetic markers used to establish the consensus genetic map (Simon et al., 2008).

