
Figure 4.
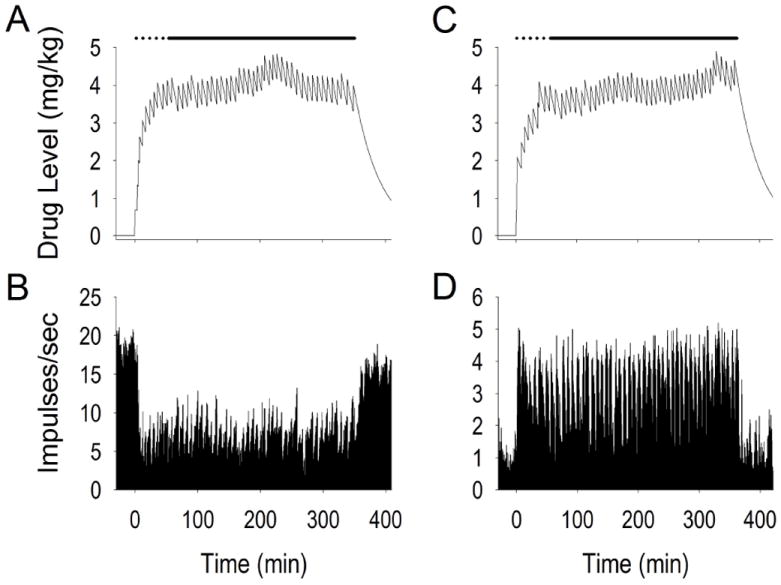
Examples of tonic change neuron firing before, during, and following self-administration. Time prior to time 0 is the half hour prior to self-administration. Time 0 on the x-axes (min) is the time of the first infusion. Panels A and C display calculated drug level while panels B and D display firing rate over the course of the recording session. Time scale labels on panels B and D correspond directly with time course for drug level data shown in panels A and C. Dotted line above each drug accumulation curve is drug “load” period consisting of ten rapid self-infusions. Solid black line above each curve is drug “maintenance” period consisting of evenly spaced inter-infusion intervals which maintain relatively constant drug levels. The end of the solid black line indicates removal of the lever (start of the post self-administration phase) and subsequent decline in drug levels.