
Figure 6.
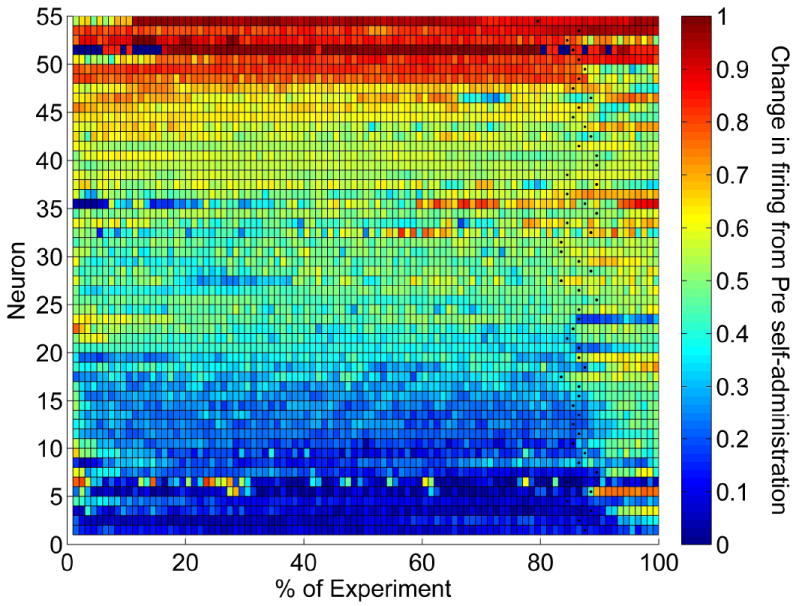
Tonic change in firing of the entire population of recorded VP neurons. Each neuron is displayed as a row along the x-axis (experimental time) with time 0 at the first self-infusion of cocaine. Color refers to change in firing from pre self-administration phase. Due to differences in recording duration (all phases totaling between 7 and 12 hours), each experimental time course was normalized to percentage values with each block representing one percent. Black dots indicate start of the post self-administration phase in which the lever was removed. Color indicates standardized change in firing ‘B/(A+B)’ in which average firing rate in each percent bin equaled ‘B’ and average pre self-administration firing rates (-20 min to 0 min prior to the first self-infusion) equaled ‘A’ (0.5 = no change; values < 0.5 = decrease; values > 0.5 = increase).