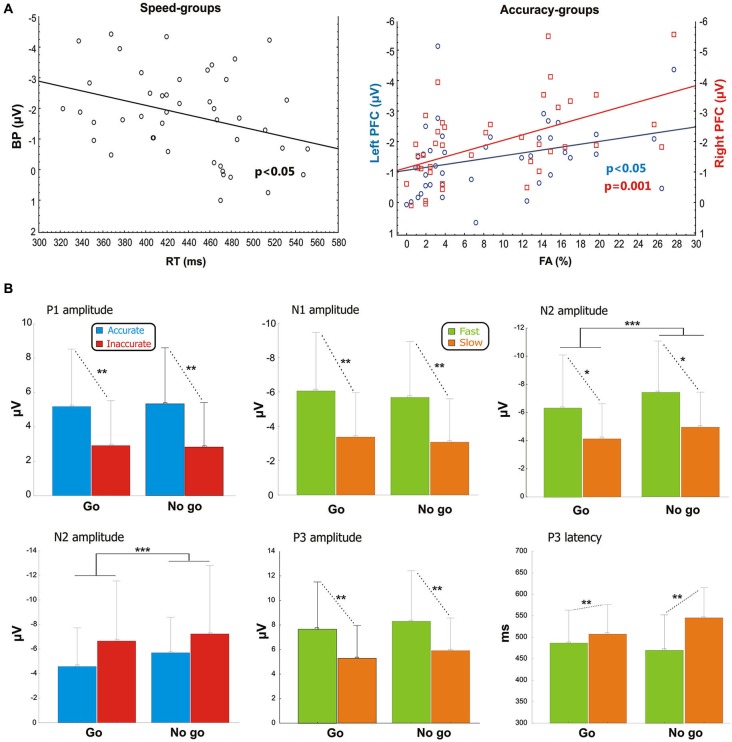
Figure 3.
(A) Pre-stimulus activity. Left side: correlation scatterplot of the RT with the BP amplitude in the Speed-groups. Right side: correlation scatterplot of the FA with both the left and right PFC activity (indexed by the pN) in the Accuracy-groups. (B) Post-stimulus activity: means and standard deviations of the main ERPs components. From the upper left: P1 amplitude in Accuracy-groups; N1 amplitude in Speed-groups; N2 amplitude in Speed-groups; N2 amplitude in Accuracy-groups; P3 amplitude in Speed-groups; P3 latency in Speed-groups. * p < 0.05; ** p < 0.01; *** p < 0.001.

