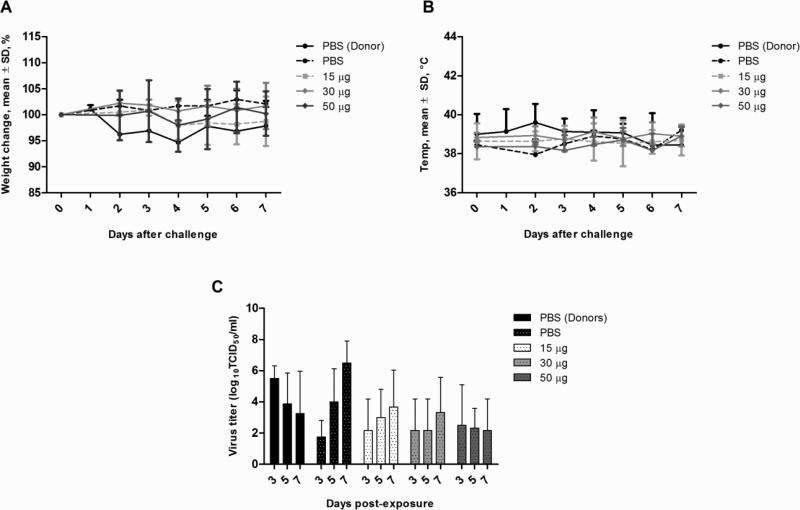
Figure 3.
Clinical signs and viral load in vaccinated contact and donor ferrets in the transmission experiment. Groups of 3 ferrets were vaccinated and 3 weeks later placed into the same cage with a donor ferret infected with 106 EID50 of virus. Ferrets were monitored for weight (A) and temperature changes (B) daily up to 7 days post-infection. Data are presented as mean ± standard deviation of percentage of weight change over baseline (day 0, pre-infection). Viral shedding (C) was determined from nasal washes collected on days 3, 5, and 7 post-infection. Viral titer data are presented as mean log10 TCID50/ml in nasal washes. Statistical testing was done using the ANOVA test with p<0.05 deemed significant compared with the PBS control-contact group.

