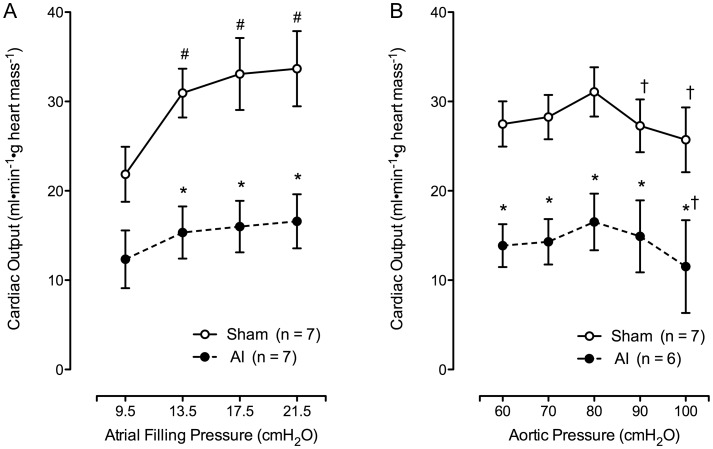
FIGURE 2:
Left ventricular function curves depicting the relationship between CO and left ventricular filling pressure (A; sham: n = 7, AI: n = 7) as well as aortic pressure (B; sham: n = 7, AI: n = 6) in the sham and AI animals. The AI animals unable to achieve aortic overflow during the entirety of afterload manipulations (n = 1) have been excluded. As shown, CO was significantly impaired in the AI compared with the sham animals with increasing filling pressure and aortic pressure. Values are mean ± SEM; AI, 5/6 ablation–infarction animals, *P < 0.05 versus sham; #P < 0.05 versus 9.5 cm H2O value; †P < 0.05 versus 80 cm H2O value.

