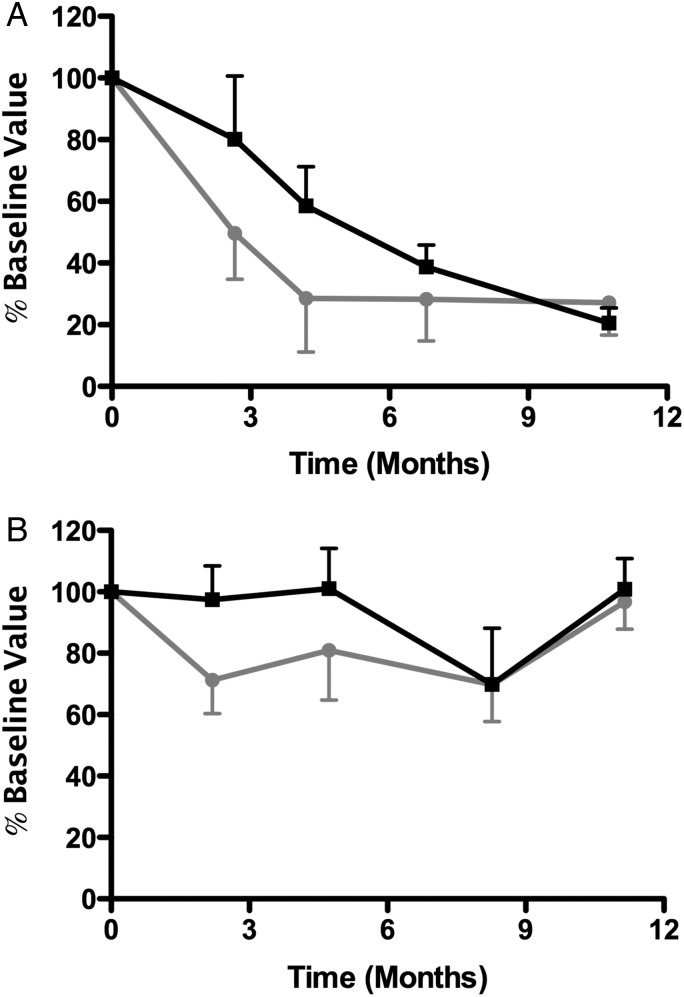
FIGURE 3:
Association between proteinuria and anti-PLA2R antibody. In antibody-positive patients, the association between proteinuria (black squares) and the anti-PLA2R antibody (gray circles) versus time is plotted. (A) Patients wherein a response was noted. (B) Patients who did not respond either clinically or immunologically to ACTH therapy.

