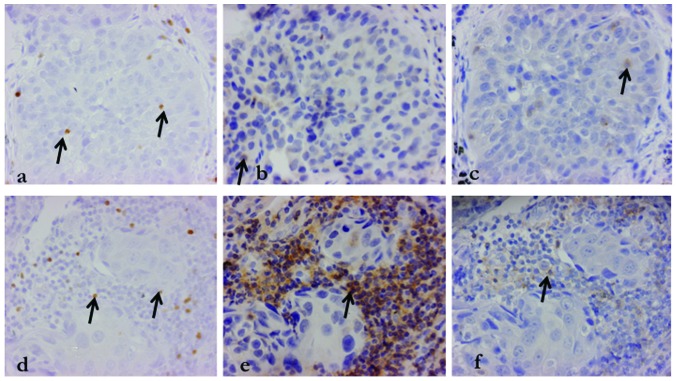
Figure 1.
Immunohistochemical analysis of an adenocarcinoma specimen. The arrows indicate positive cells for each stain; (a) cFoxP3, (b) cCD4, (c) cCD8, (d) iFoxp3, (e) iCD4 and (f) iCD8. The same field was examined for each stain for accurate validation. FoxP3, forkhead box P3; c, central; i, interstitial.

