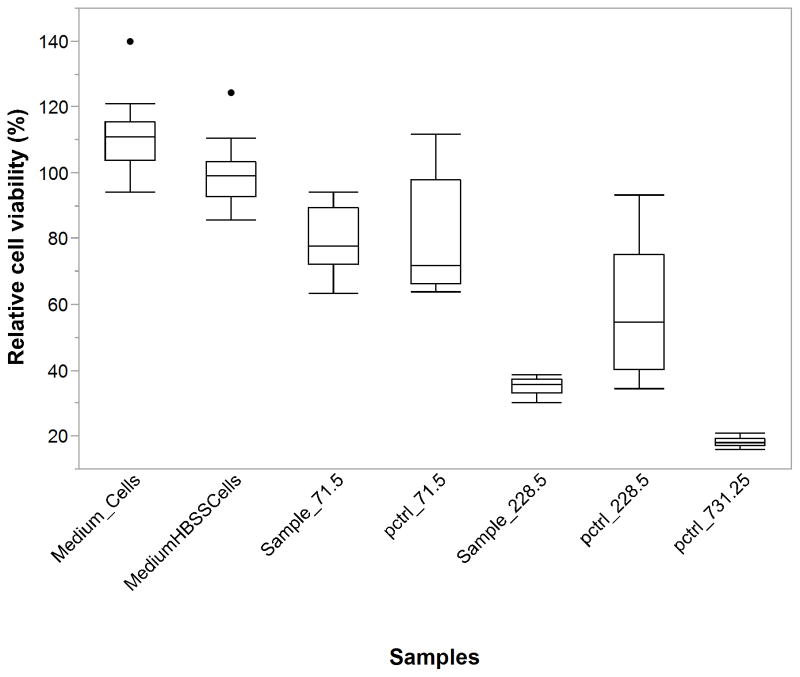
Figure 8.
Viability of EA-HY926 cells (quantified by WST-1) after exposure to the samples with different concentrations of DNR released from PLGA-pSiO2_21/40-DNR for 5 days. Medium_Cells=medium plus cells; MediumHBSSCells=culture medium 75% plus HBSS 25% plus cells; pctrl=positive control. The concentration unit is ng/mL. In the box plot, the box represents the middle 50% of the data sample. The upper 25% of the data was represented by the upper whisker while the lower 25% of the data represented by the lower whisker. The median line was within the box. The outliers were denoted by the dots above or below the whiskers of the box.

