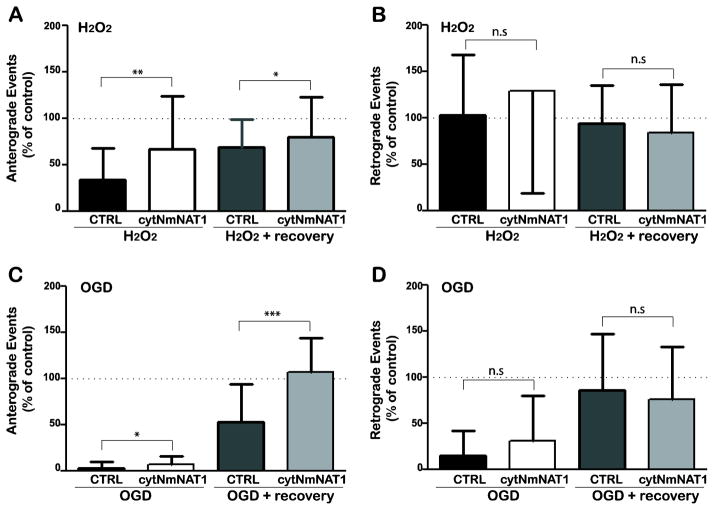
Figure 2. Expression of cytNmNAT1 protects against inhibition of the transport of Golgi-derived vesicles.
Cultured hippocampal neurons were electroporated with either soluble GFP (control) or cytNmNAT1-GFP before plating, then were transfected with constructs to label Golgi-derived vesicles (NgCAM-GFP or ssNPY-GFP) 7 days later. (A, B) Neurons were treated with hydrogen peroxide (100 μM for 30min), then imaged immediately (H2O2) or returned to normal medium and allowed to recover for 1 h before imaging (H2O2 + recovery). Hydrogen peroxide caused a profound reduction in the number of anterograde vesicle movements (> 65% inhibition compared with untreated neurons), which recovered only partially (33% residual inhibition) (A). There was no reduction in the number of retrograde movements (B). In neurons expressing cytNmNAT1, the inhibition of anterograde vesicle transport was significantly reduced and recovery was significantly improved. (C, D) Neurons were subject to OGD for 4 h and imaged immediately (OGD) or returned to normal medium and imaged after a 2 h recovery period (OGD + recovery). Immediately after OGD, anterograde vesicle transport (C) was almost completely eliminated in control neurons. Expression of cytNmNAT1 reduced this inhibition to a small, but statistically significant degree. When cells were returned to normal medium, vesicle transport in control neurons recovered only partially (47% residual inhibition); in contrast, anterograde vesicle transport was fully restored to normal levels in neurons expressing cytNmNAT1. Expressing cyNmNAT1 also reduced the inhibition of retrograde transport observed immediately after OGD (D), but this reduction was not statistically significant. Neurons were imaged either 8 h after expression of NgCAM-GFP (A, B) or 20 h after expression of ssNPY-mCherry (C, D). Only neurons that co-expressed vesicles markers and cytNmNAT1-GFP or GFP were imaged. Bars show means and standard deviations. * p < 0.05; ** p<0.01; *** p < 0.001

