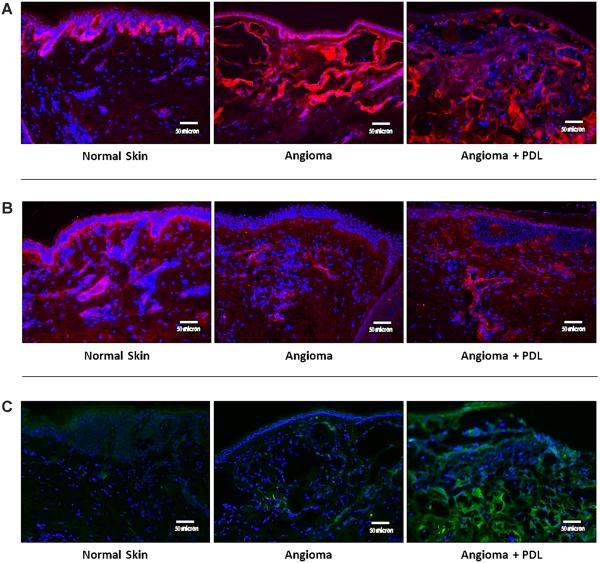
Fig. 3.
A: Representative images of bFGF. Immunofluorescence of bFGF is represented by red color. As compared to normal skin, both angiomas and angiomas + PDL demonstrated decreased bFGF staining in the epidermis but angiomas + PDL alone showed an increase in the dermis. When comparing angiomas to angioma + PDL, there was a clear dermal increase of bFGF expression. B: Representative images of MMP-9. Immunofluorescence of MMP-9 is represented by red color. As compared to normal skin, both angiomas and angiomas + PDL showed decreased or unchanged expression in the epidermis but angiomas alone had increased expression in the endothelial cells. C: Representative images of ANG-2. Immunofluorescence of ANG-2 is represented by green color. ANG-2 was increased in the endothelial cells of angiomas and angiomas + PDL when compared with normal skin.

