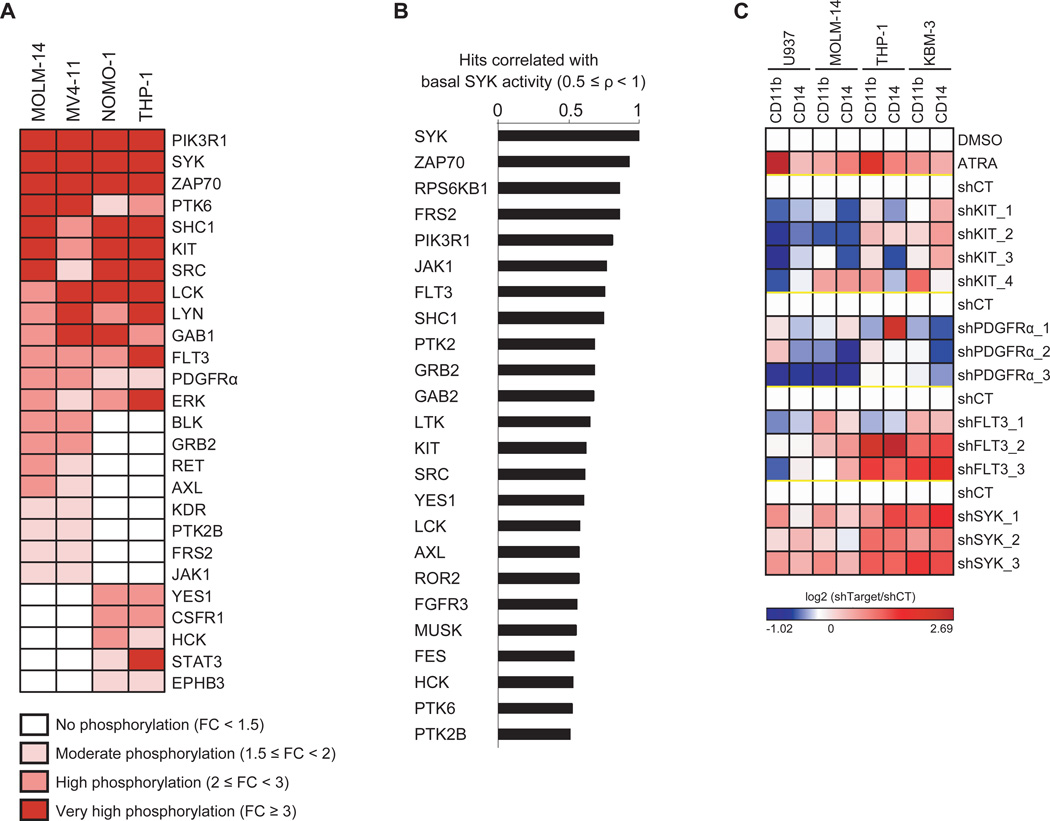
Figure 1. FLT3 Activation Correlates with SYK Activation in AML.
(A) Lysates from AML cell lines stably transduced with either a constitutively activated form of SYK (SYK-TEL) or an empty vector (CT) were evaluated by kinase activity profiling. The log2-transformed ratio (SYK-TEL versus CT) of tyrosine phosphorylation is depicted as a heatmap where each protein is ranked by its phosphorylation level across the cell lines. FC = Fold Change.
(B) Spearman correlation between basal phosphorylation of SYK compared to all other detected candidates in the kinase activity profiling assay across 12 AML cell lines. The most highly correlated hits (ρ ≥ 0.5) are represented on the histogram.
(C) Heatmap showing level of CD14 and CD11b-positive myeloid differentiation in AML cell lines treated with ATRA or transduced with a control shRNA (shCT) or KIT-, PDGFRα-, FLT3- or SYK-targeting shRNAs. Normalized data are presented as a log2-ratio (shTarget versus shCT).
See also Figure S1

