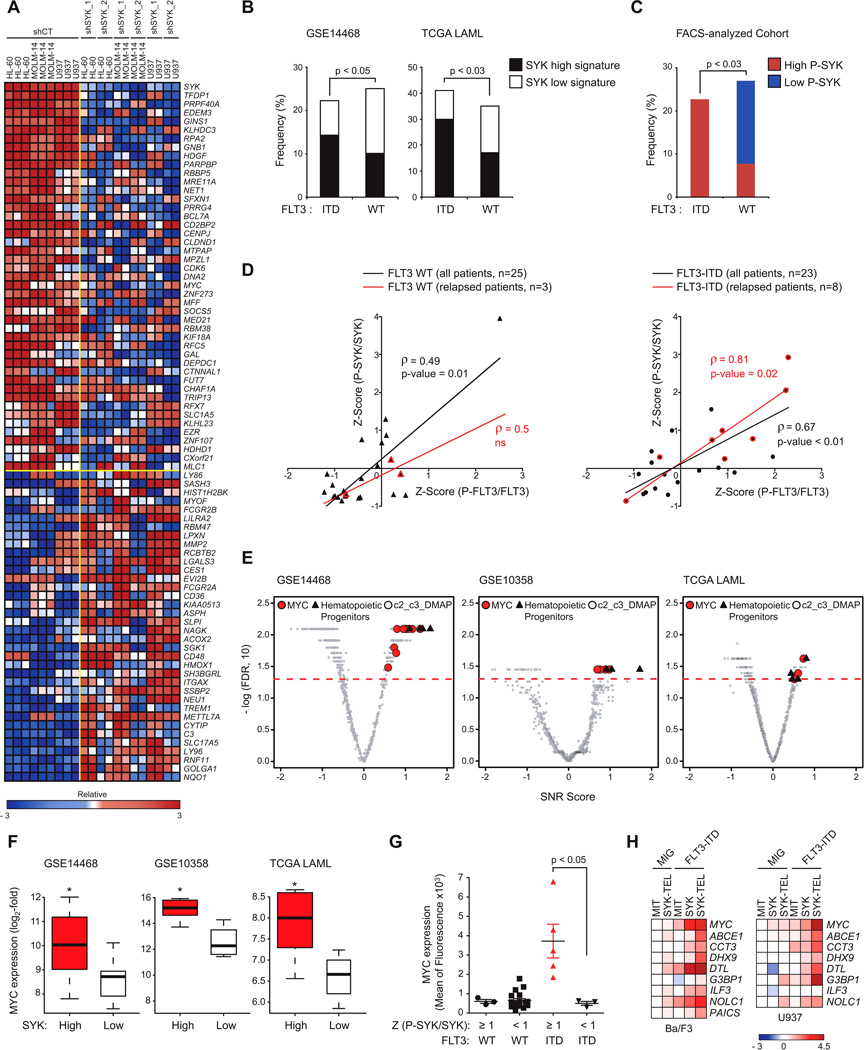
Figure 5. Highly Activated SYK Is Enriched in FLT3-ITD Patient AML Samples and Is Associated with MYC-related Transcriptional Programs.
(A) Heatmap of the top down- and up-regulated genes following transduction of AML cell lines with CT or two SYK-targeting shRNAs based on an SNR Score and p < 0.05. Data are presented row normalized.
(B) Bar graph showing the frequency of primary patient AML samples with FLT3 WT versus FLT3-ITD displaying SYK high versus low signatures in two cohorts GSE14468 (n=526) and TCGA LAML (n=179). p value calculated using Fisher exact test.
(C) Bar graph showing the frequency of primary patient AML samples with FLT3 WT (n=25) versus FLT3-ITD (n=23) exhibiting a high (Z-Score ≥ 1) versus low (Z-Score ≤ −1) level of (P-SYK/SYK) evaluated by phospho-flow cytometry on CD13/33-gated population. p value calculated using Fisher exact test.
(D) Spearman correlation (ρ-score) between (P-SYK/SYK) and (P-FLT3/FLT3) following Z-Score normalization across two subgroups of FLT3 WT and ITD patients. Highlighted in red are samples from patients at time of relapse.
(E) Quantitative comparison of gene sets available from the MSig and DMAP database by ssGSEA for patient AML samples with FLT3-ITD from three different cohorts (GSE 14468, 10358 and TCGA LAML) displaying a SYK high versus low signature. Red dots indicate sets for MYC, black triangles for hematopoietic progenitors, and gray for all other available gene sets.
(F) Comparison of MYC expression level for patient samples with FLT3-ITD from three different cohorts (GSE 14468, 10358 and TCGA LAML) displaying a SYK high versus low signature. p value calculated using Fisher exact test. Error bars represent mean +/− SD.
(G) MYC protein level evaluated by intracellular flow cytometry on a cohort of FLT3 WT or ITD patient samples (n=25) exhibiting either high (Z-Score (P-SYK/SYK) ≥ 1) or medium to low (Z-Score (P-SYK/SYK) < 1) SYK activation. p value calculated using a Mann-Whitney test. Error bars represent mean +/− SEM.
(H) Heatmap showing expression level of MYC transcriptional target genes evaluated by qRT-PCR. Normalized data are presented as a log2-ratio versus MIT.
See also Figure S5, Tables S1, S2, and S3

