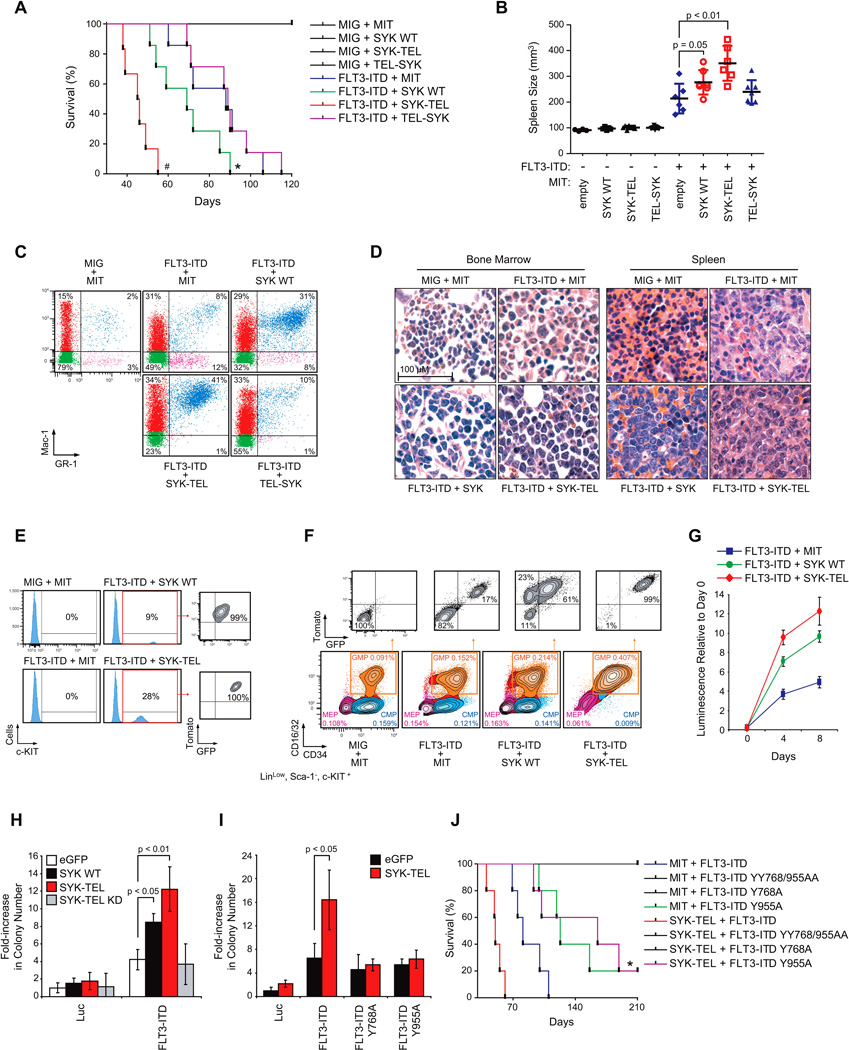
Figure 6. High SYK Activation Synergizes with FLT3-ITD to Promote Progression to AML.
(A) Kaplan-Meier curves showing overall survival of mice (n=7 for each group except for FLT3-ITD + SYK-TEL group for which n=6) transplanted with myeloid cells expressing each combination of indicated constructs. Statistical significance determined by Log-Rank (Mantel-Cox) test. *, p=0.05 and #, p<0.01 by comparison with FLT3-ITD + MIT group.
(B) Spleen size measurement by microtomography of six mice per group when FLT3-ITD + SYK-TEL mice became moribund. p value calculated using a Mann-Whitney test. Error bars represent mean +/− SEM.
(C) FACS analysis of Mac-1 and GR-1 expressing populations in spleen. A representative FACS plot from each group is shown. Analysis was performed after FLT3-ITD + SYK-TEL mice became moribund.
(D) H&E staining of bone marrow and spleen of a representative moribund mouse from each indicated group.
(E) FACS analysis of c-KIT expressing cells in spleen after five days in culture. One representative moribund mouse from each indicated group is shown.
(F) Proportion of CMP (CD16/32−/CD34+), GMP (CD16/32+/CD34+) and MEP (CD16/32−/CD34−) cell populations on gated LinLow/Sca-1−/c-KIT+ myeloid progenitors. Tomato and GFP expression were evaluated on each GMP cell population. One representative moribund mouse from each group is shown.
(G) Double tomato and GFP positive LinLow/Sca-1−/c-KIT+ myeloid cells were sorted from the whole bone marrow harvested from moribund mice transplanted with each combination of FLT3-ITD and SYK vectors. Growth post-sorting is shown relative to the day zero (time of seeding) values, with error bars representing the mean +/− SD.
(H and I) Purified normal CD34+ human primary cells were infected with (H) FLT3-ITD in combination with different forms of SYK (wild-type, constitutively active SYK-TEL, or inactive SYK-TEL KD) or (I) SYK-TEL in combination with either FLT3-ITD or the two mutants FLT3-ITD Y768A and Y955A. Colony number was evaluated after MTT staining. p < 0.01 and p < 0.05 calculated using a Mann-Whitney test. Error bars represent mean +/− SD.
(J) Kaplan-Meier curves showing overall survival of mice (n=5 for each group) transplanted with myeloid cells expressing each indicated combination of FLT3-ITD or FLT3-ITD mutants (Y > A) in combination with SYK-TEL. Statistical significance determined by Log-Rank (Mantel-Cox) test. *, p = 0.05 by comparison with FLT3-ITD group.
See also Figure S6

