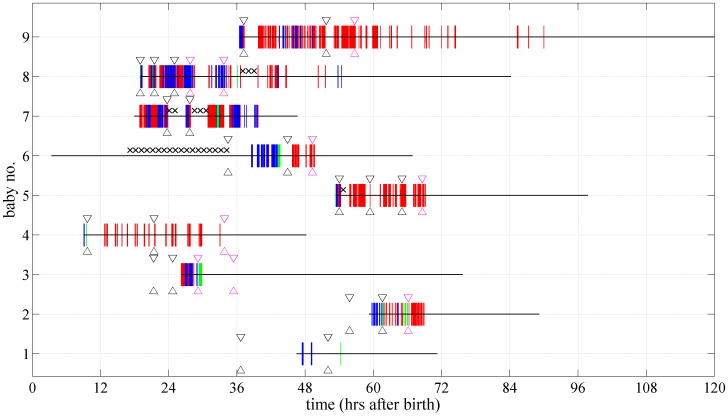
Figure 3. Characteristics of seizures and anticonvulsant administration in each neonate.
Vertical red lines denote the presence of electrographic-only seizures, vertical blue lines denote electroclinical seizures and vertical green lines denote obscured seizures. Horizontal black line denotes the period of EEG monitoring. Black crosses denote missing data. Timepoints bounded by black arrows denote the first-line anticonvulsant administration while the magenta arrows denote the second-line anticonvulsant administration.

