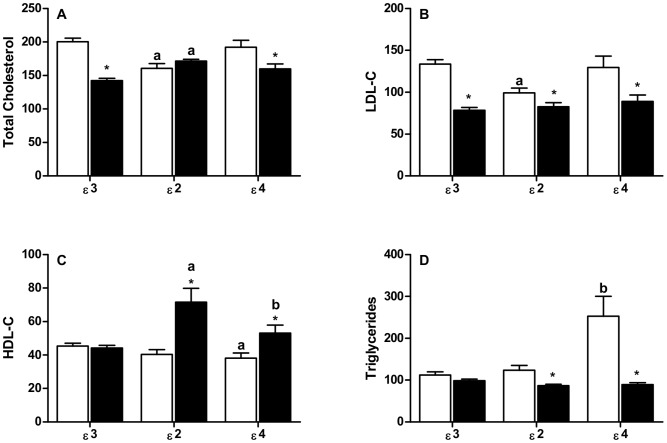
Figure 1. Effect of APOE gene polymorphism on plasma levels of Total Cholesterol (A), LDL-C (B), HDL-C (C), and Triglycerides (D) in Control subjects (open bars) and SM patients (filled bars).
Plasma lipids are expressed in mg/dL. * = P<0.05 for group of SM patients vs. Control of the same allele. Comparisons between the different alleles of the same SM patient group, or of the same Control group, are indicated as follows: a = P<0.05 vs. ε3; b = P<0.05 vs. ε2 and ε3. Exact P values are given in Table 3.

