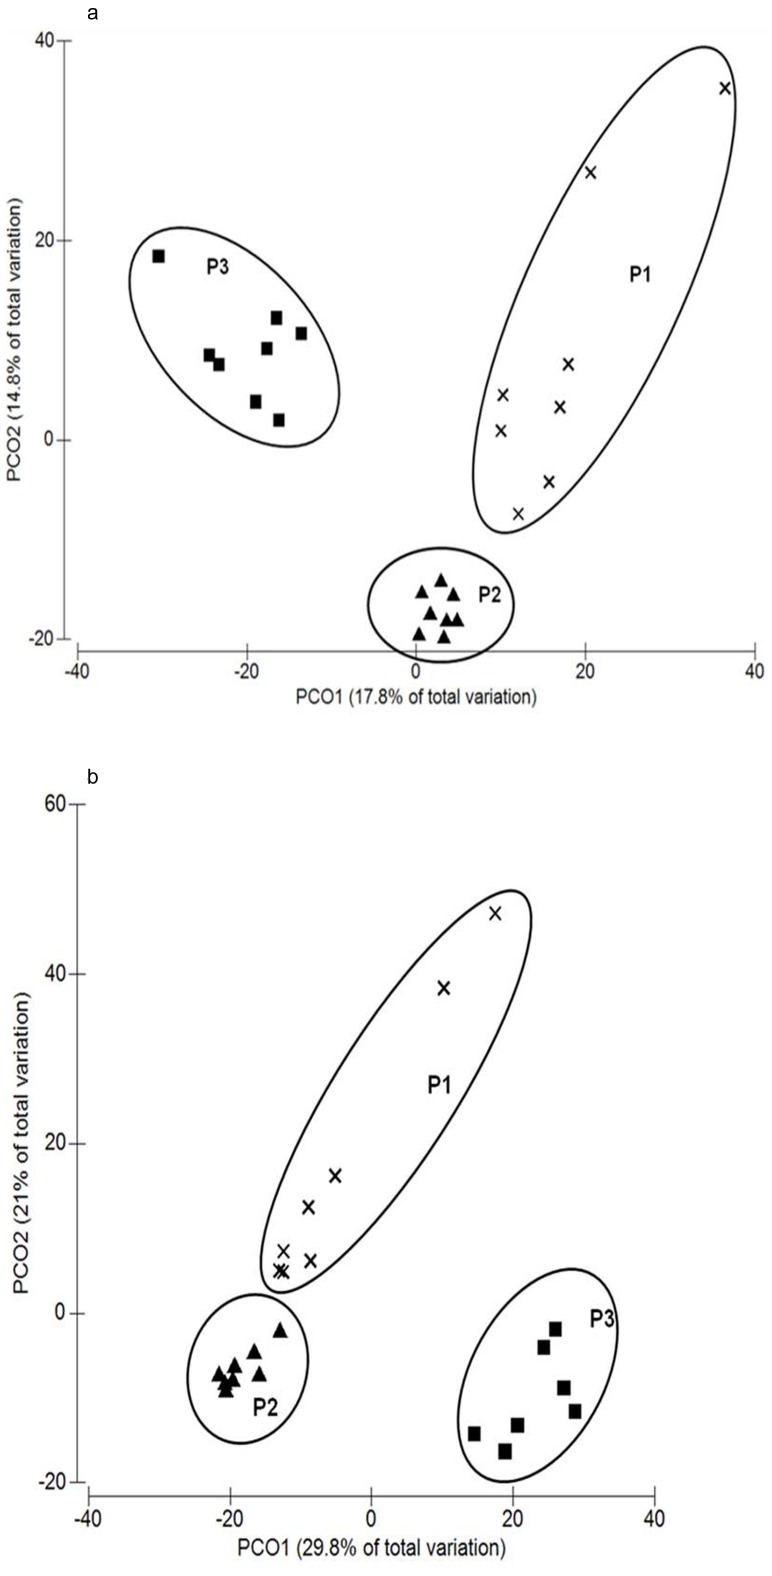
Figure 3. PCA plot of the rumen bacterial structure analysed by T-RFLP(a) or NGS(b).
Principal Component Analysis of T-RFLP (Figure 4a, peaks in the amplicons of 16S rRNA gene digested using HhaI, HaeIII, MspI and RsaI (dendrogram shows amalgamation of data from all four enzymes) or NGS (Figure 4b, OTU matrix from Ion Torrent data). Genomic DNA was obtained from rumen samples from 8 animals either protozoa-free (P1, black crosses), faunated with holotrich protozoa (P2, black triangles) or with a complete protozoal population (P3, black squares).

