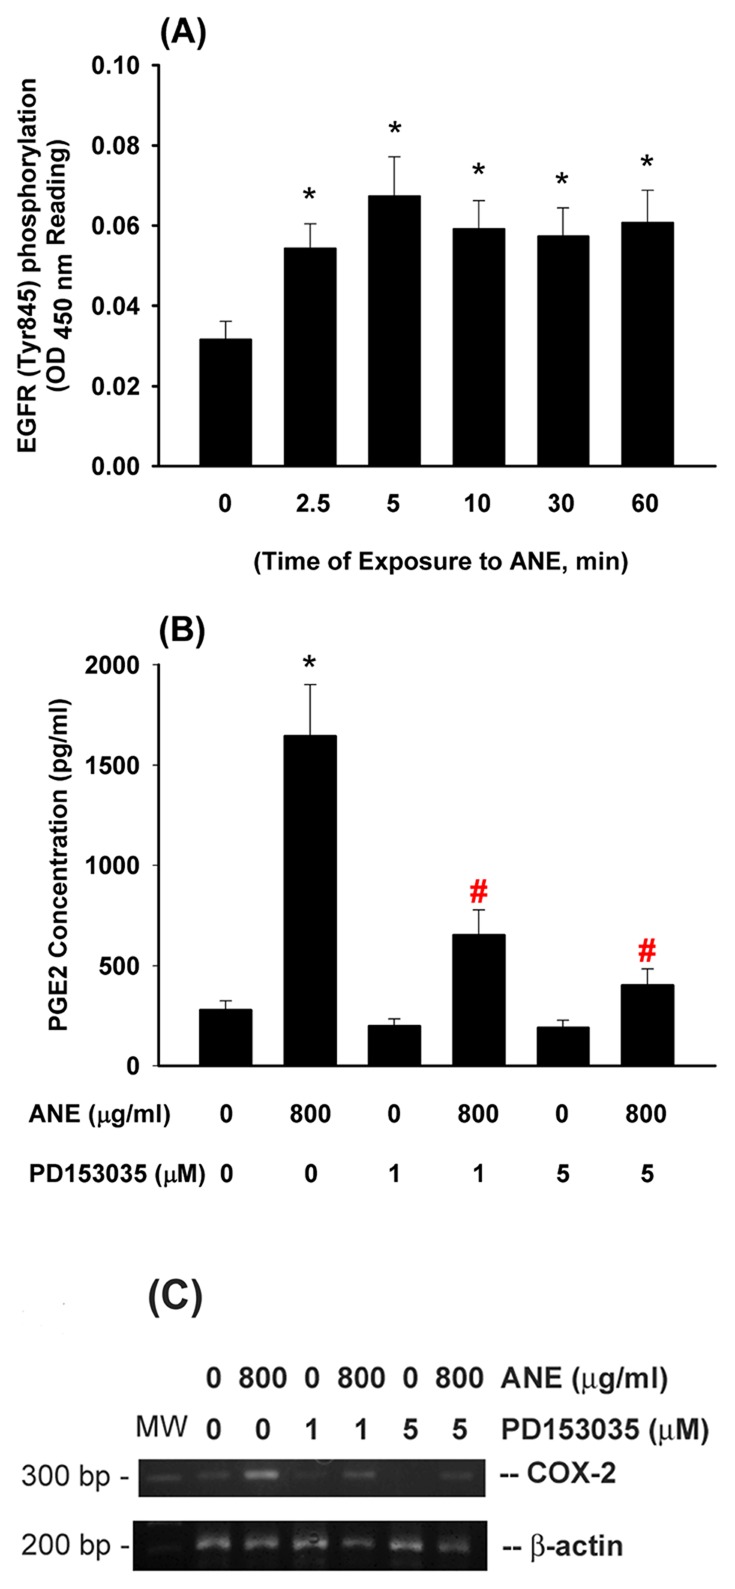
Figure 3. Effect of ANE on EGFR activation and its role in ANE-induced COX-2 expression and PGE2 production of GK.

(A) AN extract (ANE) stimulated EGFR (Tyr845) phorphorylation within 60 min of exposure as analyzed by Pathscan p-EGFR ELISA. *denotes significant difference when compared with solvent control. (n = 10). (B) Pretreatment by PD153035 (1 and 5 µM, an EGFR antagonist) markedly attenuated the ANE-induced PGE2 production in GK. (C) Effect of PD153035 on ANE-induced COX-2 expression in GK. One representative PCR result was shown. *denotes significant difference when compared with solvent control. #denotes significant difference when compared with ANE (800 µg/ml)-treated group.
