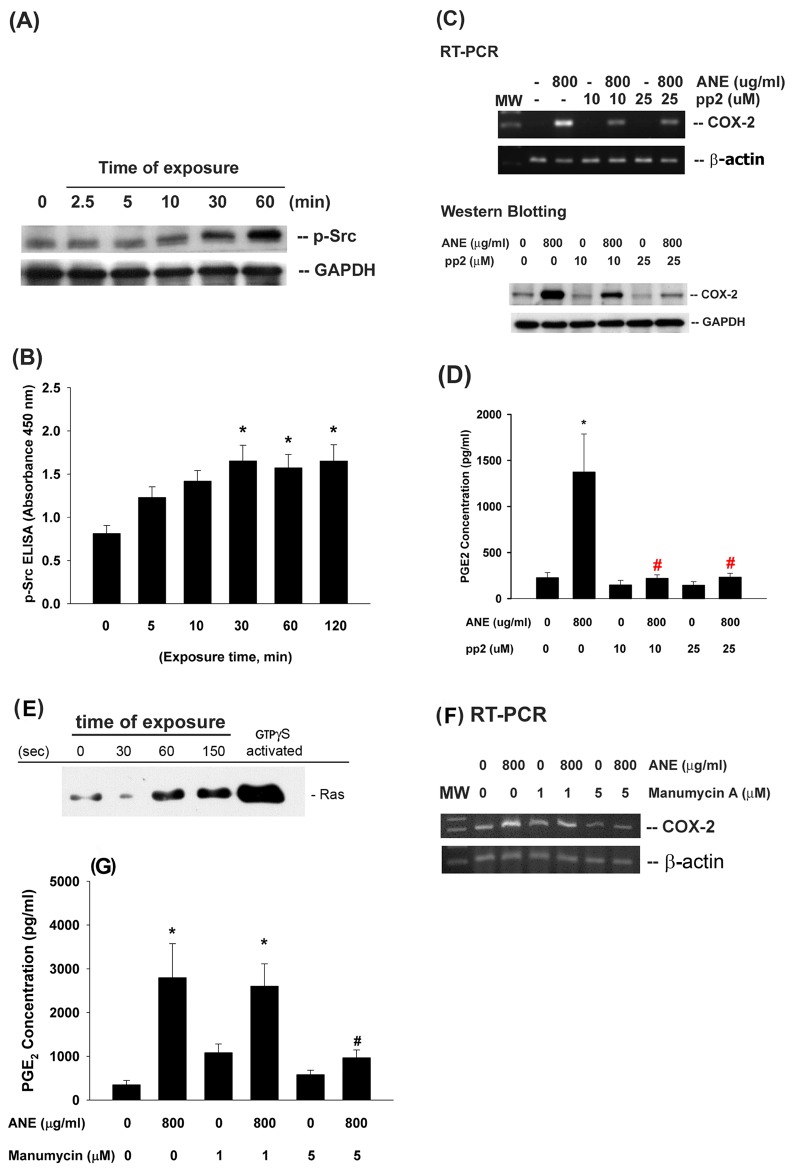
Figure 4. Effect of ANE on Src and Ras activation and its role in ANE-induced COX-2 expression and PGE2 production of GK.
(A) GK were exposed to ANE (800 µg/ml) for different time points. Cell lysates were collected and used for analysis of Src phosphorylation (p-Src) by pathscan p-ELISA. Results were expressed as absorbance (OD450) (n = 9). *denotes significant difference when compared with control. (B) Inhibition of ANE-induced Src phosphorylation in GK by pp2, (C) pp2 inhibited the ANE-induced COX-2 mRNA and protein expression in GK. One representative PCR and western blotting result was shown. (D) pp2 prevented the ANE-induced PGE2 production in GK (n = 5). (E) ANE induced the activation of Ras in GK. GK were exposed to ANE (800 µg/ml) for different time points (30–150 secs). Cell lysates were collected and used for analysis of Ras activation using Ras activation assay kit (Pierce). GTPγS-activated was the positive control. (F) Manumycin A (1 and 5 µM) effectively prevented the ANE-induced COX-2 expression of GK, (G) Manumycin A also attenuated the ANE-induced PGE2 production of GK. *denotes significant difference when compared with solvent control. #denotes statistical significant difference when compared with ANE (800 µg/ml) solely-treated group (P<0.05)

