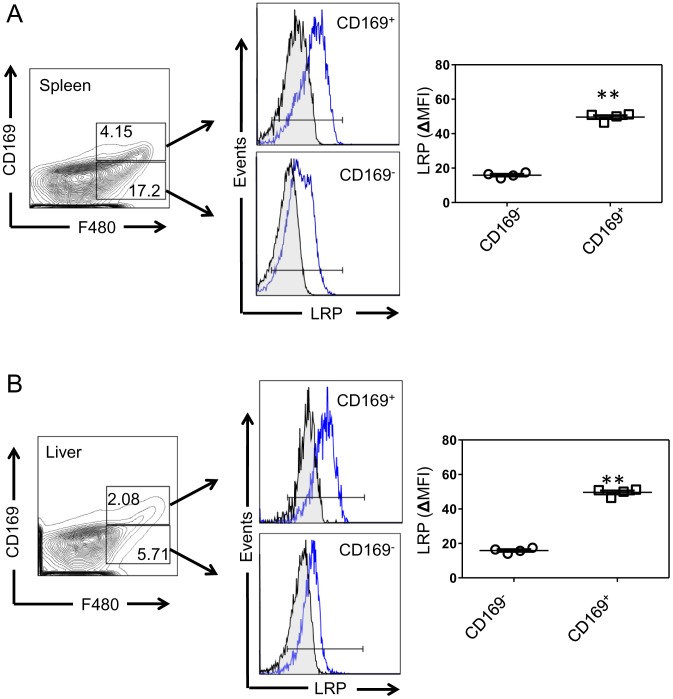
Figure 2. LRP expression in CD169+ MΦs.
(A) Spleen and (B) liver mononuclear lymphocytes from 8-to-12 week old WT mice (n = 4) were stained with fluorochrome-conjugated antibodies for MΦs (F4/80) and CD169. Left panels show dot plots for F4/80 and CD169 and middle panels show representative histograms of LRP expression (blue line) versus isotype control (black line). Graphs show quantification of mean fluorescent intensity (MFI = LRP antibody- isotype antibody). Bars represent mean and standard error. **denotes p<0.001. P-value determined by Student's t-test. Histograms are from one representative experiment of three separate experiments. Scatter plots show individual animals from one representative experiment of three.

