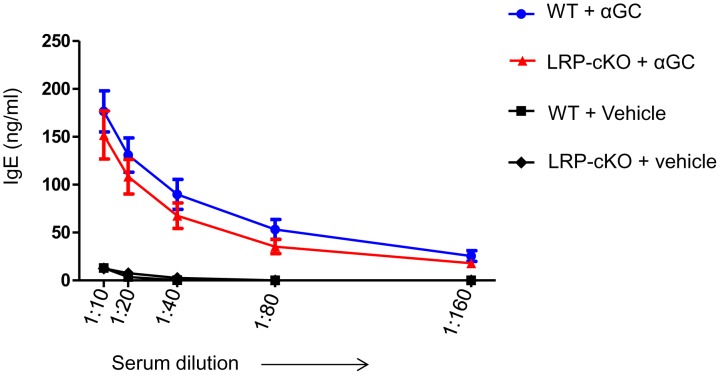
Figure 6. Induction of IgE in LRP-cKO mice is normal when compared to WT.
Both WT (n = 8) and LRP-cKO (n = 6) mice were challenged with αGC (4 µg/mouse) and vehicle (WT, n = 3, LRP-cKO n = 2). Blood was collected at 0 and 6 days and total serum IgE levels measured by ELISA. Bars represent mean and standard error. These results are from one experiment.

