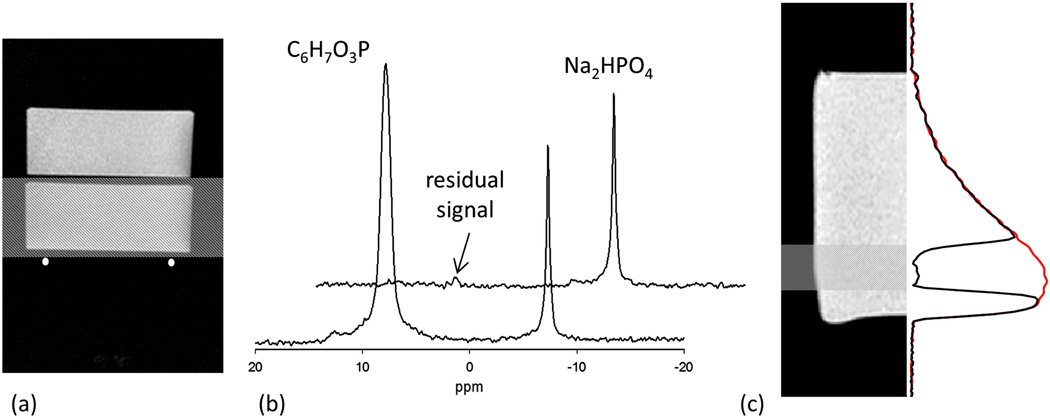
Figure 2.
(a) Image of two compartment phantom showing the location of the RF coil. The shaded region represents position of ROI. (b) Front spectrum shows the signal from the phantom without any localization and a large peak from phenylphosphonic acid compartment closer to the RF coil is visible. Spectrum in the back is the result of addition of two spectra with and without the inversion of spins in the selected ROI. The addition of the two spectra shows almost complete suppression of spectral peak from phenylphosphonic acid. (c) The image of the phantom, location of ROI and 1D-spectrum. Red spectrum shows the signal without saturation band and the signal in the selected ROI is eliminated when the saturation band is placed. The decaying profile of spectrum represents the loss of sensitivity of the surface coil with distance from the coil.

