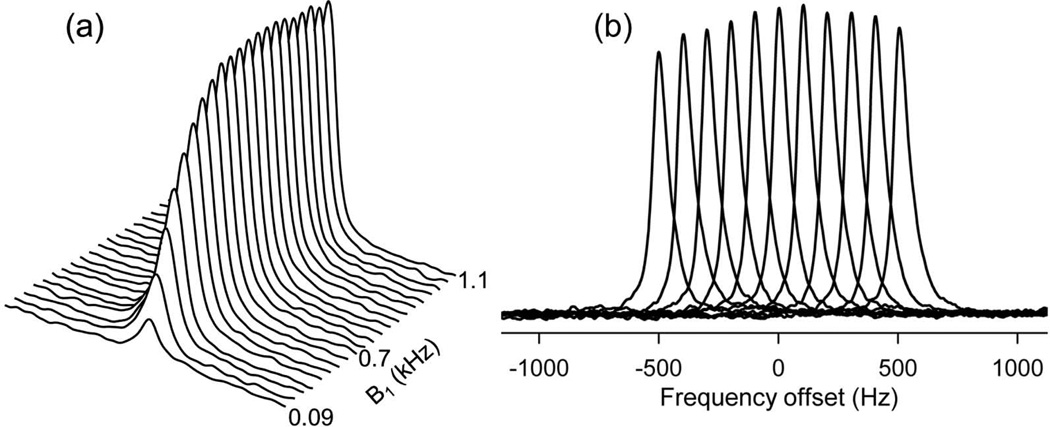
Figure 3.
(a) Spectrum demonstrating calibration of AHP pulse. Spectrum amplitude initially increased with B1 field strength and reached a maximum value at B1 = 0.7 kHz. Further increase in B1 did not affect the spectral peak intensity confirming uniform 90° excitation over the region of interest. (b) Plot shows the frequency dependence of AHP pulse. The adiabatic conditions were met in ~400 Hz around the resonance frequency. This bandwidth is appropriate to simultaneously quantify PCr and γ-ATP which are approximately 120 Hz apart at 3T.

