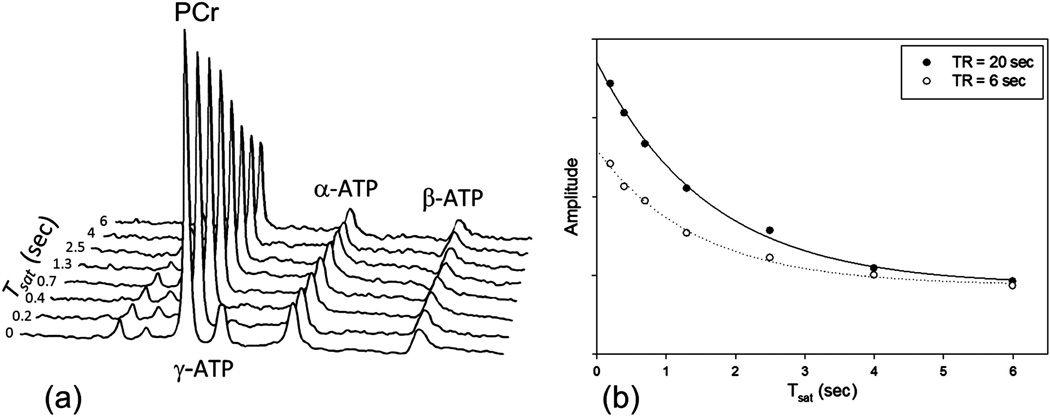
Figure 5.
(a) Representative TDST spectra from the leg. The PCr peak intensity decreases as the saturation time for γ-ATP is increased. (b) Data and fitting results shown for long (d1 = 20 sec) and short (d1 = 6 sec). The plots show similar apparent relaxation rate constant and steady state magnetization. Short TR acquisition resulted in 63% time savings for the experiment.

