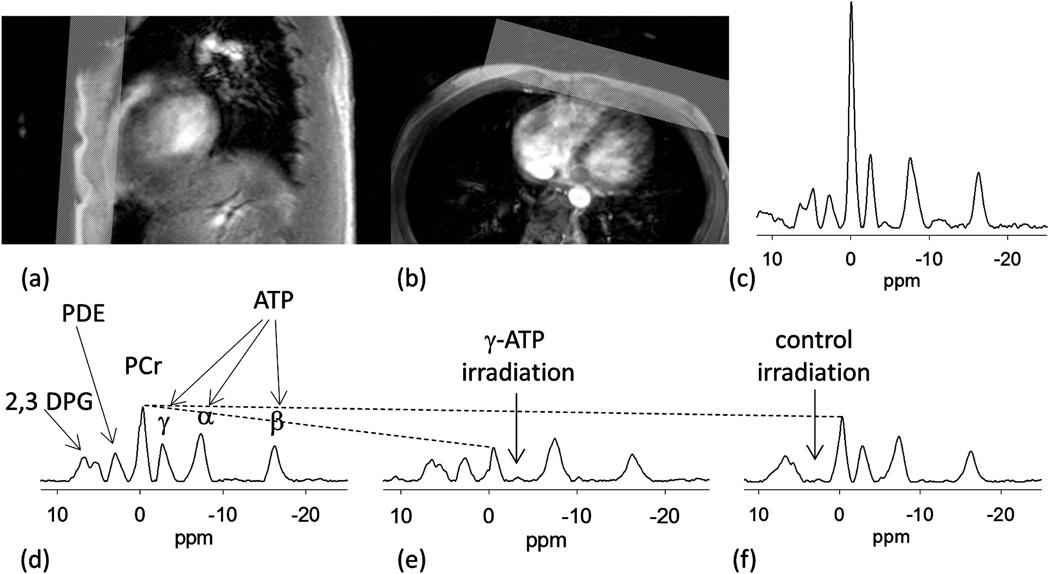
Figure 6.
Sagittal (a) and axial (b) reference images of the heart and placement of the ROI. (b) A small fiducial marking the center of the RF coil is visible in the images. (c) Spectrum without localization shows a large PCr peak relative to ATP indicating signal arising from the chest muscles. (d) Typical spectrum from heart without selective RF irradiation detailing the peaks of PCr, ATP, PDE and 2,3 DPG. (e) Representative spectra from a saturation transfer experiment when γ-ATP peak is saturated. The decrease in PCr peak is due to the transfer of saturation between γ-ATP and PCr through the CK reaction. (f) Control spectrum with selective RF irradiation at 2.5 ppm. The arrows identify the frequency of the saturating irradiation. The dotted line gives a visual cue of direct saturation of PCr peak due to imperfect selectivity of saturating pulse.

