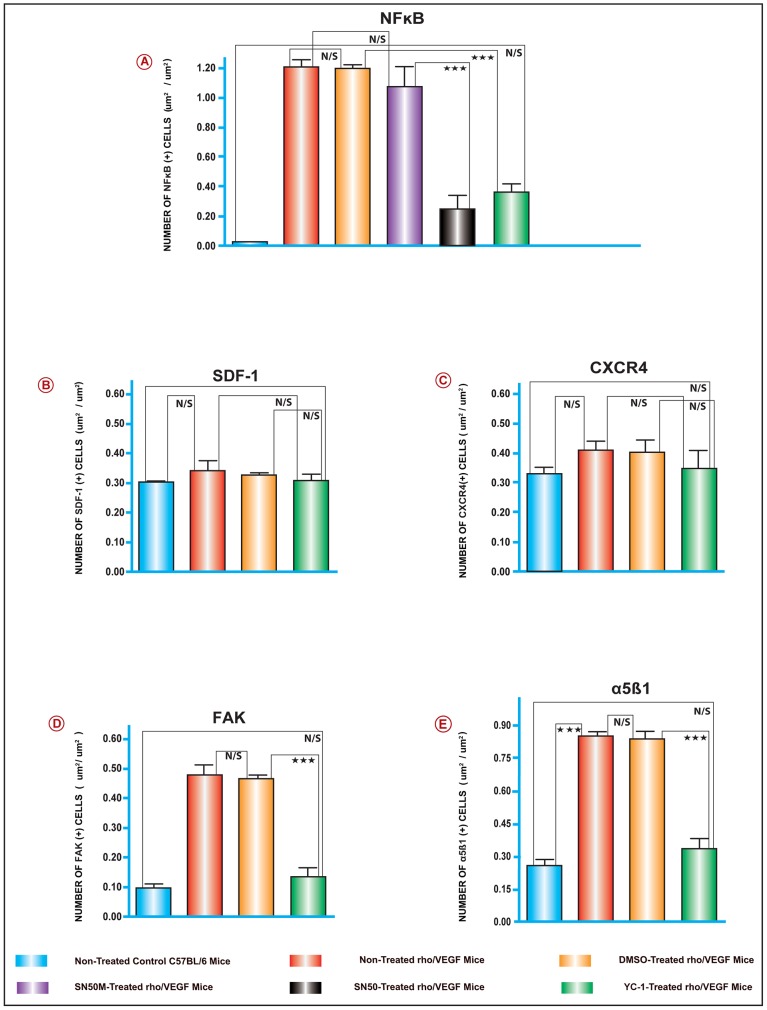
Figure 10. Quantitative Assessments of Retinal Immunohistochemical Staining Analyses.
Retinal tissue specimens were compared between normal C57BL/6, non-treated rho/VEGF, and all other treatments. The collected images of the retinas were imported to the image analysis system Metamorph 7.1. All image analyses were conducted in a masked fashion. Values obtained from at least 5 retinal fields were used to calculate the average pixel intensity value per retina. Bar graphs exhibit the intensity of staining of various proteins in all groups. The area of staining was measured in (um2/um2) in all groups. Values (mean ± SEM), from 3 separate experiments from at least 10 images from 4 different eyes/group. (***P<0.001 and **P<0.01). Data are representative of 3 independent experiments.

