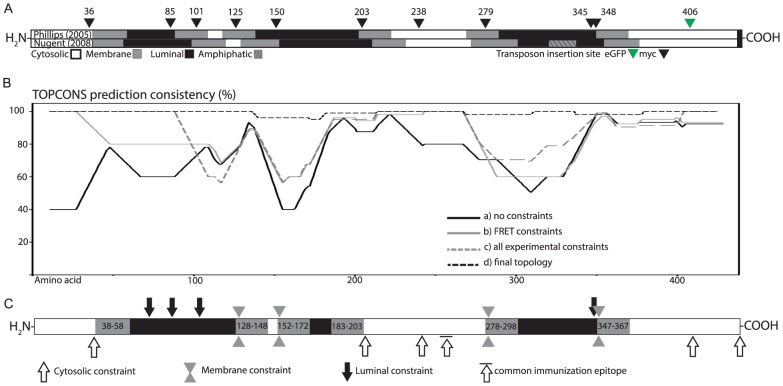
Figure 3. In silico compilation of FRET and other data as hCLN3 models using TOPCONS constrained membrane prediction algorithm.
A: The transmembrane domains (grey), cytosolic (white) and luminal (black) loops from earlier hCLN3 models together with transposon insertion sites (black arrows for myc-tag, green for eGFP) are illustrated [25]. B: The reliability scores for CLN3 topology predictions indicating the consistency agreement between different prediction algorithms included in TOPCONS are shown as percentage. C: A schematic illustration of the new membrane topology obtained using constraints from FRET analysis, previously published experimental data, and the iterative approach. The cytosolic constraint with a line on top reflects the common epitope for two earlier used antibodies.

