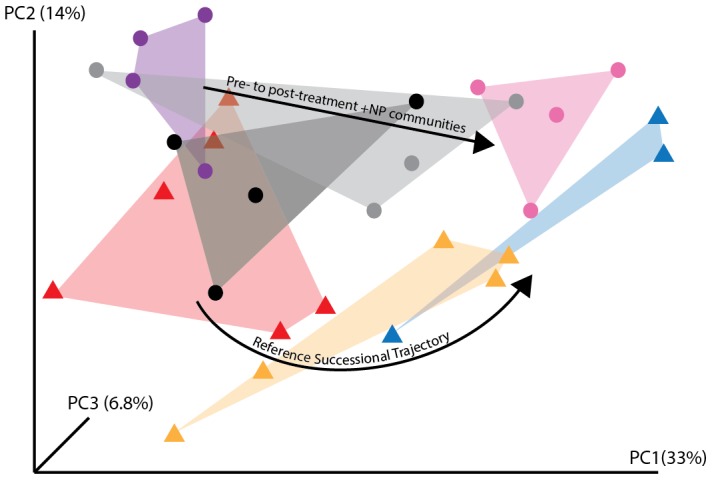
Figure 1. Principal Coordinates Analysis (PCoA) ordination plot of bacterial communities from the field fertilization experiment and bacterial communities from the successional chronosequence.

Only the +NP treatment communities are shown because the +N and +P treatments did not result in significant community shifts. PCoA visually represents differences among community composition as the distance between points. Triangles represent communities from the natural chronosequence: red = 5 years old; orange = 20 years old; blue = 85 years old. Circles represent communities from the fertilization experiment: black = pre-treatment control; grey = post-treatment control; purple = pretreatment +NP; Pink = post-treatment +NP. Our analysis revealed significant community shifts over the reference chronosequence (triangles) as well as a significant response to +NP fertilization (circles). As well, the PCoA analysis demonstrates that the +NP communities (pink circles) group with the oldest soils from the chronosequence (blue triangles).
